Product Images Tadalafil

View Photos of Packaging, Labels & Appearance

Product Label Images

The following 10 images provide visual information about the product associated with Tadalafil NDC 71335-1620 by Bryant Ranch Prepack, such as packaging, labeling, and the appearance of the drug itself. This resource could be helpful for medical professionals, pharmacists, and patients seeking to verify medication information and ensure they have the correct product.

Label - lbl713351620

Label - lbl713351620

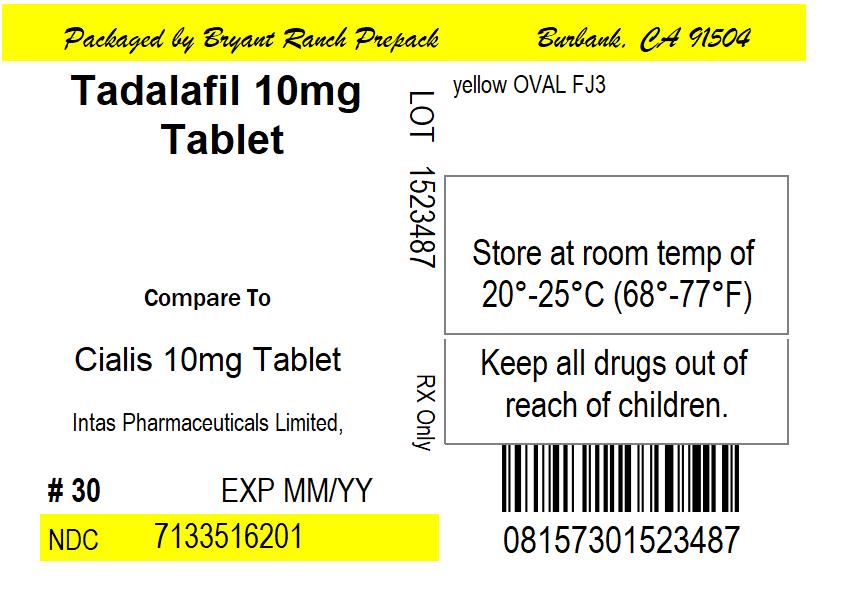
This is a description for Tadalafil 10mg tablets, manufactured by Intas Pharmaceuticals Limited. The tablets are oval shaped and yellow in color with the imprint "FJ3". They are packaged in a bottle of 30 tablets and should be stored at room temperature. These tablets are similar to the branded drug Cialis 10mg and should be kept out of reach of children.*

Figure - tadalafil figure1

Figure - tadalafil figure1

The text is a table with blood pressure measurements for standing and supine positions, comparing Tadalafil with Placebo. It shows the difference between the two drugs in millimeters of mercury (mmHg). Time is also displayed on the table in hours.*

Figure - tadalafil figure2

Figure - tadalafil figure2

This is a data table showing information about a medical study for a combination of Tadalafil 20mg and doxazosin 8mg vs Placebo and doxazosin 8mg. The table includes time post-dose and various values for the treatment groups. There is no further information available.*

Figure - tadalafil figure3

Figure - tadalafil figure3

Figure - tadalafil figure4

Figure - tadalafil figure4

This is a chart that shows the concentration of tadalafil in plasma over time, measured in micrograms per liter (ug/L). There are three lines on the chart representing different dosages: a single 20-mg dose, a single 5-mg dose, and a once-daily 5-mg dose following 5 consecutive days of administration. The chart also includes a time axis in hours up to 120 hours (or 5 days) after dosing.*

Figure 5 - tadalafil figure5

Figure 5 - tadalafil figure5

The text describes a chart or graph showing the change from baseline in IPSS (International Prostate Symptom Score) total scores in patients over a duration of treatment in weeks. The treatment involves tadalafil and placebo, and the chart indicates a statistically significant improvement with tadalafil compared to placebo.*

Figure 6 - tadalafil figure6

Figure 6 - tadalafil figure6

Figure 7 - tadalafil figure7

Figure 7 - tadalafil figure7

Figure 8 - tadalafil figure8

Figure 8 - tadalafil figure8

Chemical Structure - tadalafil structure

Chemical Structure - tadalafil structure

* The product label images have been analyzed using a combination of traditional computing and machine learning techniques. It should be noted that the descriptions provided may not be entirely accurate as they are experimental in nature. Use the information in this page at your own discretion and risk.