Clopidogrel Bisulfate Tablet, Film Coated
Product Images NDC 71335-1646

View Photos of Packaging, Regulatory Labels, and Product Appearance

Product Visual Gallery

This gallery contains 10 technical images submitted to the FDA as part of the official labeling for Clopidogrel Bisulfate (NDC 71335-1646). Unlike standard consumer photos, these assets often include clinical data figures, molecular chemical structures, and official manufacturer packaging layouts.

As provided by Bryant Ranch Prepack, these visuals offer a comprehensive scientific overview of the product's physical and chemical identity, aiding pharmacists and researchers in product verification and study.

FDA Label Image

Figure1 (Clopidogrel Fig)

Figure1 (Clopidogrel Fig)
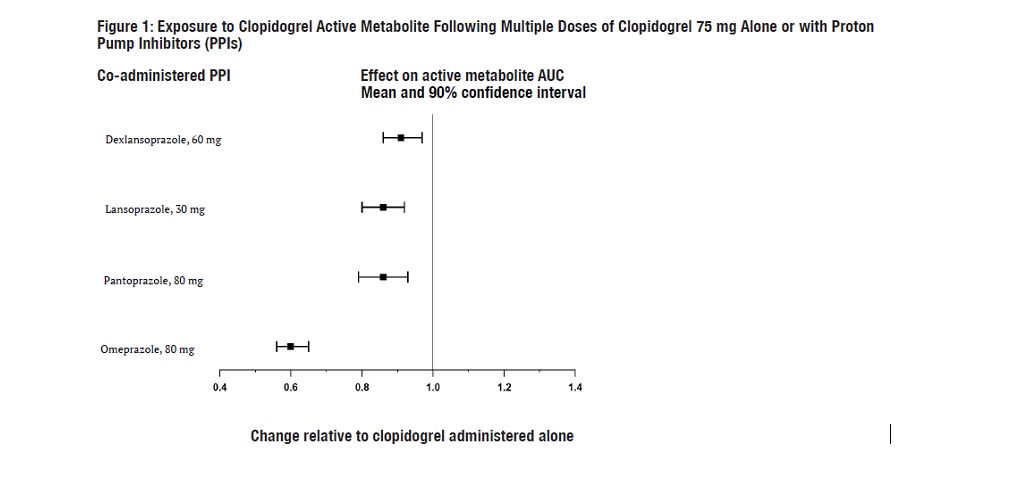
This is a figure showing the effect of proton pump inhibitors (PPIs) on exposure to Clopidogrel active metabolite after multiple doses of Clopidogrel 75 mg. The figure includes mean and 90% confidence interval values for PPIs like Deslansoprazole, Lansoprszole, Pantoprazole, and Omeprazole, and how they affect active metabolite AUC. It also shows the change relative to Clopidogrel administered alone.*
FDA Label Image

Figure3 (Clopidogrel Fig2)

Figure3 (Clopidogrel Fig2)
This is a medical study comparing the effectiveness of a placebo (with aspirin) group versus a group taking clopidogrel (with aspirin) in preventing cardiovascular death, myocardial infarction, and stroke. The study shows a significantly lower cumulative event rate in the clopidogrel group. The study followed patients for up to 12 months and standard therapies were also used.*
FDA Label Image

Figure3 (Clopidogrel Fig3)

FDA Label Image

Figure4 (Clopidogrel Fig4)

Figure4 (Clopidogrel Fig4)
The image shows the cumulative event rates for death in the COMMIT study, with a comparison between the placebo group and the clopidogrel group. Before the first discharge, 8.1% of patients on the placebo died, while 7.5% of patients on clopidogrel died. There was a 7% proportional risk reduction (with a p-value of 0.03) for patients on clopidogrel. The x-axis shows the days since randomization (up to 28 days) and all treated patients received aspirin.*
FDA Label Image

Figure5 (Clopidogrel Fig5)

Figure5 (Clopidogrel Fig5)
This text compares the effectiveness of two medications, placebo and clopidogrel, in reducing the risk of death, re-infarction, or stroke. Based on the data, clopidogrel has a 9% lower proportional risk compared to placebo. Additionally, there was a 7% reduction in death with clopidogrel compared to placebo (p=0.002). The text includes a graph showing the number of events over time since randomization, up to 28 days.*
FDA Label Image

Figure6 (Clopidogrel Fig6)

Figure6 (Clopidogrel Fig6)
This appears to be a table or figure from a study called COMMIT investigating the effects of adding Clopidogrel to Aspirin on a primary endpoint. The table/figure shows the effects across different subgroups based on baseline and concomitant medication. Unfortunately, there's not enough information to decipher the units, values, and outcomes presented in the figure due to the unclear .*
FDA Label Image

Figure7 (Clopidogrel Fig7)

Figure7 (Clopidogrel Fig7)
This document appears to be a graph or chart showing the cumulative event rate for fatal or non-fatal vascular events over 24 months of follow-up for two medications: aspirin and clopidogrel. The x-axis represents the time in months, while the y-axis represents the percentage of patients experiencing a vascular event. The chart displays data points at 6-month intervals. Without additional information, it is not possible to provide further context or interpretation.*
FDA Label Image

Figure8 (Clopidogrel Fig8)

Figure8 (Clopidogrel Fig8)
This is a table showing the hazard ratio and confidence interval by baseline subgroups in the CAPRIE Study for a qualifying condition. There are three subgroups: stroke, M (not clear what this stands for), and PAD. The table displays the number of participants for each subgroup and the percentage of those who took Clopidogrel or Aspirin, as well as the hazard ratio and 95% confidence interval.*
FDA Label Image

Structure (Clopidogrel Str)

FDA Label Image

Label Image (Lbl713351646)

Label Image (Lbl713351646)
This appears to be a description of a medication called Clopidogrel, which comes in 75mg tablets. It is manufactured by ScieGen Pharmaceuticals and is a generic equivalent to Plavix. The tablets should be stored at room temperature between 20°C to 25°C (68°F to 77°F) and kept tightly closed. The text also includes a lot number, an expiration date, and the National Drug Code (NDC) for the tablets. There is also some text that may be referencing a ranch and a bank, but it is not clear how it relates to the medication.*

* These product label images have been analyzed using experimental machine learning. Please verify findings with the primary label text.