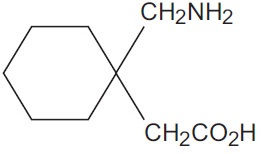
Formula (Gabapentin Fig1)

This appears to be a formula for calculating a medical indicator known as "Lt" based on a patient's age and weight, as well as their creatinine level. However, it is not clear what "Lt" represents or what use this formula has in clinical practice.*