Tramadol Hydrochloride Tablet, Extended Release
Product Images NDC 71335-1676

6 FDA label images from Bryant Ranch Prepack · Packaging, Regulatory Labels, and Product Appearance

Product Visual Gallery

This gallery contains 6 technical images submitted to the FDA as part of the official labeling for Tramadol Hydrochloride (NDC 71335-1676). Unlike standard consumer photos, these assets often include clinical data figures, molecular chemical structures, and official manufacturer packaging layouts.

As provided by Bryant Ranch Prepack, these visuals offer a comprehensive scientific overview of the product's physical and chemical identity, aiding pharmacists and researchers in product verification and study.

FDA Label Image

Label Image (Lbl713351676)
Label Image (Lbl713351676)
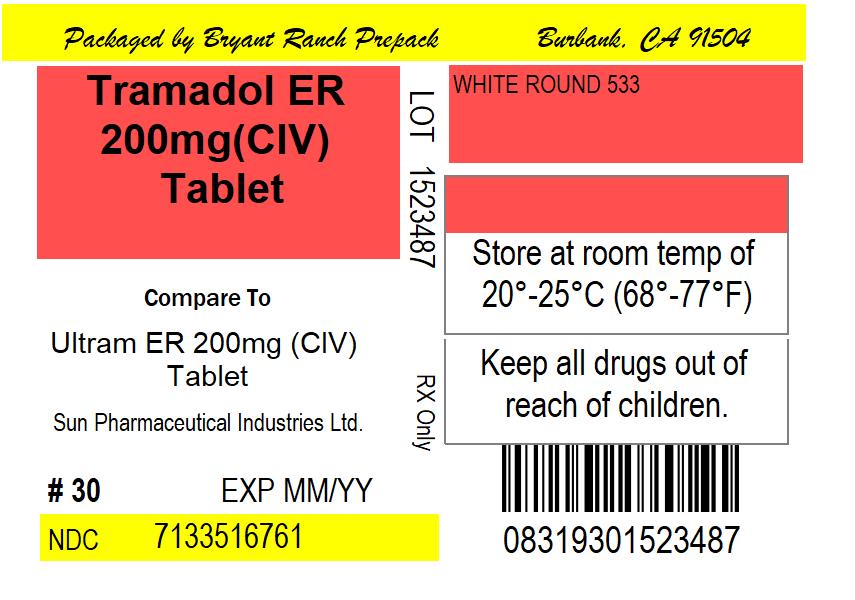
The label for Tramadol ER 200 mg extended-release tablets, a human prescription drug by Bryant Ranch Prepack. The label includes strength (200 mg), dosage form (tablet), and the statement 'Compare to Ultram ER 200 mg Tablet.' It indicates a package of 30 tablets, with storage instructions at room temperature (20°-25°C), and warnings to keep out of children's reach. The label also displays the NDC 71335-1676 and a barcode.*
FDA Label Image

Tramadol-figure1 (Tramadol Figure1)

Tramadol-figure1 (Tramadol Figure1)
A line graph comparing Tramadol plasma concentration (ng/mL) over a 24-hour period for two formulations: Tramadol Hydrochloride Extended-Release Tablets 200 mg once daily (q.d.) and Tramadol IR Tablets 50 mg every six hours (q6h). The y-axis shows tramadol concentration, and the x-axis shows time in hours.*
FDA Label Image

Tramadol-figure2 (Tramadol Figure2)

Tramadol-figure2 (Tramadol Figure2)
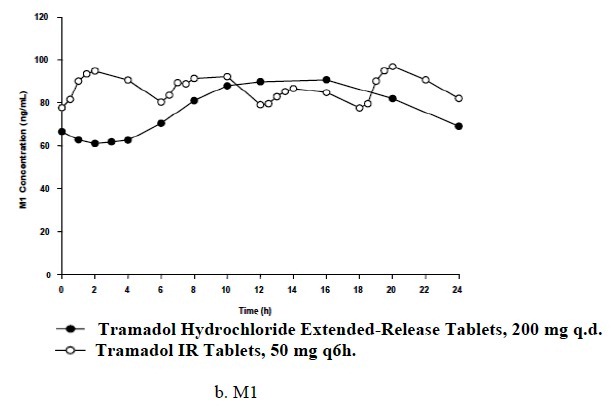
A line graph showing M1 concentration (ng/mL) over a 24-hour period comparing Tramadol Hydrochloride Extended-Release Tablets 200 mg once daily and Tramadol Immediate-Release Tablets 50 mg every 6 hours. The graph displays fluctuating concentration levels with time on the x-axis and M1 concentration on the y-axis.*
FDA Label Image

Tramadol-figure3 (Tramadol Figure3)

Tramadol-figure3 (Tramadol Figure3)
A line graph titled 'Tramadol Hydrochloride Extended-Release Tablets Study 023 WOMAC Pain Responder Analysis' showing the percent of patients achieving various response thresholds of pain improvement. The x-axis represents response threshold as percent improvement from baseline (0 to 100%) and the y-axis shows percent of patients achieving response (0 to 60%). Five lines compare different tramadol extended-release tablet doses (100 mg, 200 mg, 300 mg, 400 mg) and placebo over the range of response thresholds.*
FDA Label Image

Tramadol-figure4 (Tramadol Figure4)

Tramadol-figure4 (Tramadol Figure4)
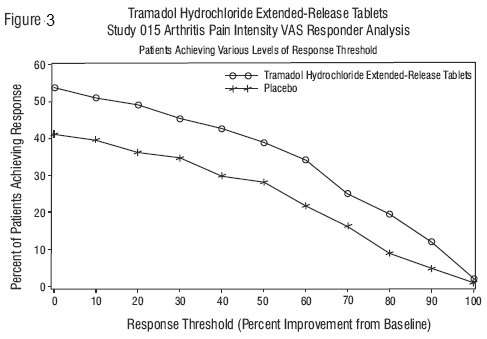
A line graph showing the percent of patients achieving response versus response threshold (percent improvement from baseline) in an arthritis pain intensity study. Two lines compare Tramadol Hydrochloride Extended-Release Tablets and placebo across various response thresholds, with Tramadol showing higher patient response rates at each threshold.*
FDA Label Image

Tramadol-structure (Tramadol Structure)

Tramadol-structure (Tramadol Structure)
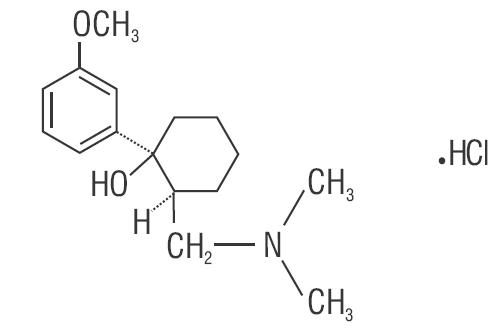
Chemical structure of tramadol hydrochloride showing the molecular arrangement including aromatic ring, cyclohexane ring, and dimethylamine group with hydrochloride salt (HCl).*

* About these descriptions: Image descriptions on this page are generated by automated AI analysis of the product label images from the manufacturer's FDA label submission (SPL). They are provided for reference only and may contain errors or omissions. Always rely on the printed label itself and the official FDA labeling, and consult a pharmacist or healthcare professional with any questions about this product.