Pregabalin Capsule
Product Images NDC 71335-1744

View Photos of Packaging, Regulatory Labels, and Product Appearance

Product Visual Gallery

This gallery contains 15 technical images submitted to the FDA as part of the official labeling for Pregabalin (NDC 71335-1744). Unlike standard consumer photos, these assets often include clinical data figures, molecular chemical structures, and official manufacturer packaging layouts.

As provided by Bryant Ranch Prepack, these visuals offer a comprehensive scientific overview of the product's physical and chemical identity, aiding pharmacists and researchers in product verification and study.

FDA Label Image

Label (Lbl713351744)

Label (Lbl713351744)
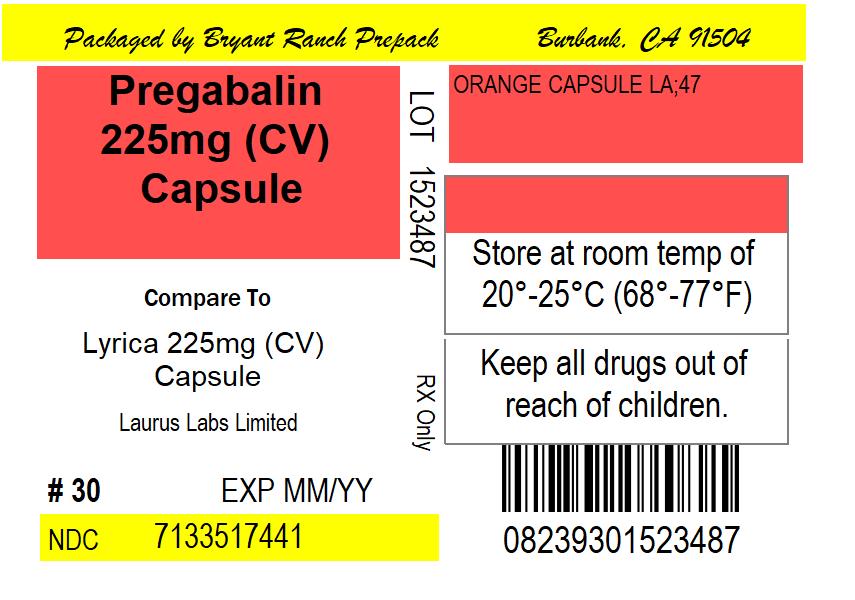
Pregabalin Capsules, USP, with NDC code 63629-8239-01 and 225 mg strength per capsule, are a prescription drug used for certain conditions. Each bottle of this drug contains 30 capsules and should be stored at 20° to 25° C (68° to 77° F) or 15° to 30° C (59° to 86° F) according to USP controlled room temperature standards. As with all drugs, keep this product out of the reach of children.*
FDA Label Image

Lbl7133517442

Lbl7133517442
This is a description of a medication packaged by Bryant Ranck Prepack. The medication is meant to be compared with Lyrica 225mg in capsule form manufactured by Laurus Labs Limited with an expiration date given as MM/YY. The medication has a National Drug Code (NDC) of 7133517441 and should be stored at room temperature. There is a warning to keep all drugs out of reach of children. The last line of text may be a barcode or tracking number.*
FDA Label Image

Pregabalinchemistrystructure (Pregabalin Chem Structure)

FDA Label Image

Pregabalin-equation (Pregabalin Equation)

FDA Label Image

Pregabalinfig1 (Pregabalin Fig 01)

Pregabalinfig1 (Pregabalin Fig 01)
The text seems incomplete and does not provide enough information to generate a useful description.*
FDA Label Image

Pregabalinfig2 (Pregabalin Fig 02)

Pregabalinfig2 (Pregabalin Fig 02)
This appears to be a chart or table that shows the percent improvement in pain from baseline for a medication called Pregabalin at a dose of 160mg over the course of 3 days. The table also includes numbers such as 100, 2, 10, 220, 23, and 280. It is not clear what these numbers represent, and the text is not readable in some places, possibly due to errors in the scanning process.*
FDA Label Image

Pregabalinfig3 (Pregabalin Fig 03)

Pregabalinfig3 (Pregabalin Fig 03)
This text appears to be a report on the improvement of patients using different medications. It includes a table with data on the percent of patients improved and different medication regimens. There is also a chart showing percent improvement in pain compared to a baseline. The text is not well-formed and may be the result of errors.*
FDA Label Image

Pregabalinfig4 (Pregabalin Fig 04)

FDA Label Image

Pregabalinfig5 (Pregabalin Fig 05)

Pregabalinfig5 (Pregabalin Fig 05)
The text seems to be a table showing the dosage of three different medications - Fregabalin, Pregataiin, and Placebo, and the percentage of patients who showed improvement in pain after taking the medication. The dosage of Fregabalin is 100 mgthrestimes a day, while that of Pregataiin is 80 mgthrestimes a day. The percentage of patients who have improved ranges from 3 to 8, followed by a series of numbers that are difficult to interpret. There is also a chart showing the percentage improvement in pain from baseline. No further information can be gathered from this text.*
FDA Label Image

Pregabalinfig6 (Pregabalin Fig 06)

FDA Label Image

Pregabalinfig7 (Pregabalin Fig 07)

FDA Label Image

Pregabalinfig8 (Pregabalin Fig 08)

Pregabalinfig8 (Pregabalin Fig 08)
This appears to be a chart or table displaying different doses of Pregabalin and a placebo, with percentages of improvement in pain from a baseline measurement. The chart shows dosages of 150mg and 450mg of Pregabalin, as well as a 100mg dose and placebo. The percentage of improvement in pain ranges from 20% to 100%.*
FDA Label Image

Pregabalinfig9 (Pregabalin Fig 09)

FDA Label Image

Pregabalinfig10 (Pregabalin Fig 10)

Pregabalinfig10 (Pregabalin Fig 10)
The text provided is giving information about the percent of subjects who improved from a baseline to week 12 under the treatment of two different drugs named "Pregetalin" and "Placeso". The percentage values for improvement are given in the table ranging from 210-240 for one drug and 260 and 100 for the other drugs respectively.*
FDA Label Image

Pregabalinfig11 (Pregabalin Fig 11)

Pregabalinfig11 (Pregabalin Fig 11)
This is a table displaying the percentage of subjects who improved after taking either Pregabalin or Placebo for 16 weeks. The percentage of subjects improved is displayed on the left column and the dosage on the top row. The only dosage displayed is 200mg for Pregabalin and Placebo.*

* These product label images have been analyzed using experimental machine learning. Please verify findings with the primary label text.