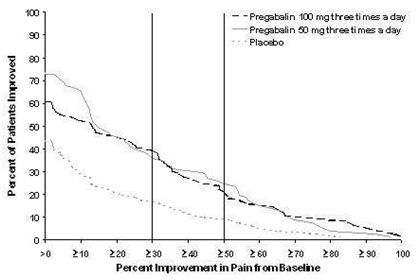
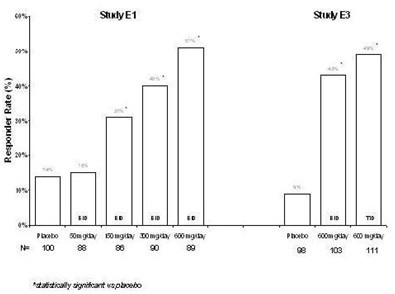
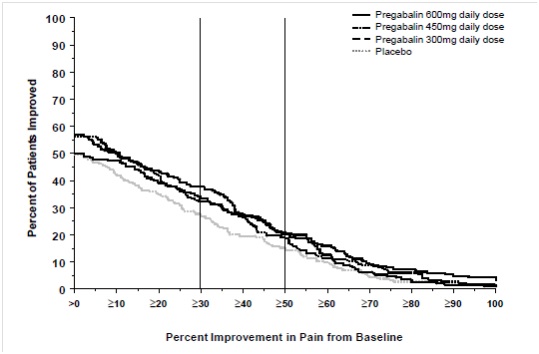
Label (Lbl713351762)
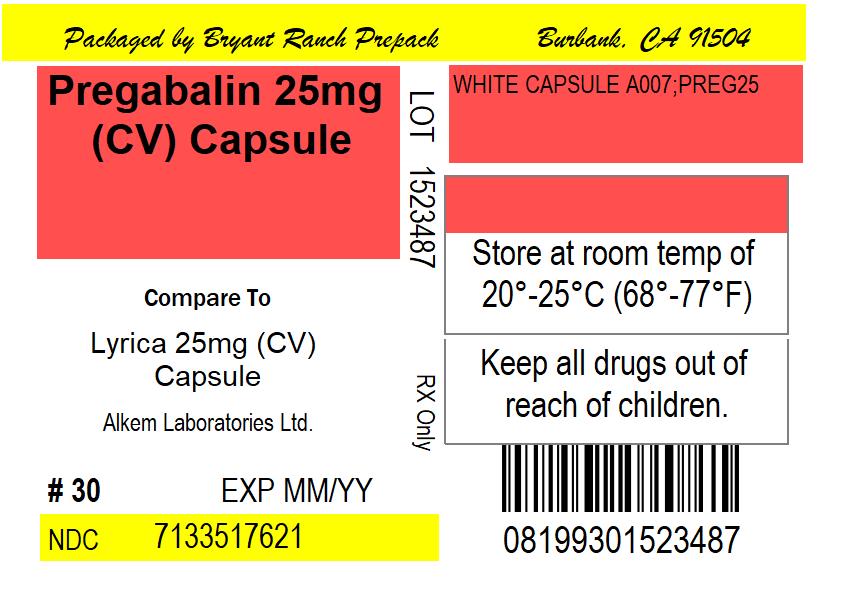
This is a medicine package for a generic version of Lyrica 25mg capsules, packaged by Bryant Ranck Prepack. The package contains 30 capsules and should be stored at room temperature. The NDC number is 7133517621. There is a warning to keep all drugs out of reach of children.*