Product Images Tamsulosin Hydrochloride
View Photos of Packaging, Labels & Appearance
Product Label Images
The following 7 images provide visual information about the product associated with Tamsulosin Hydrochloride NDC 71335-1784 by Bryant Ranch Prepack, such as packaging, labeling, and the appearance of the drug itself. This resource could be helpful for medical professionals, pharmacists, and patients seeking to verify medication information and ensure they have the correct product.
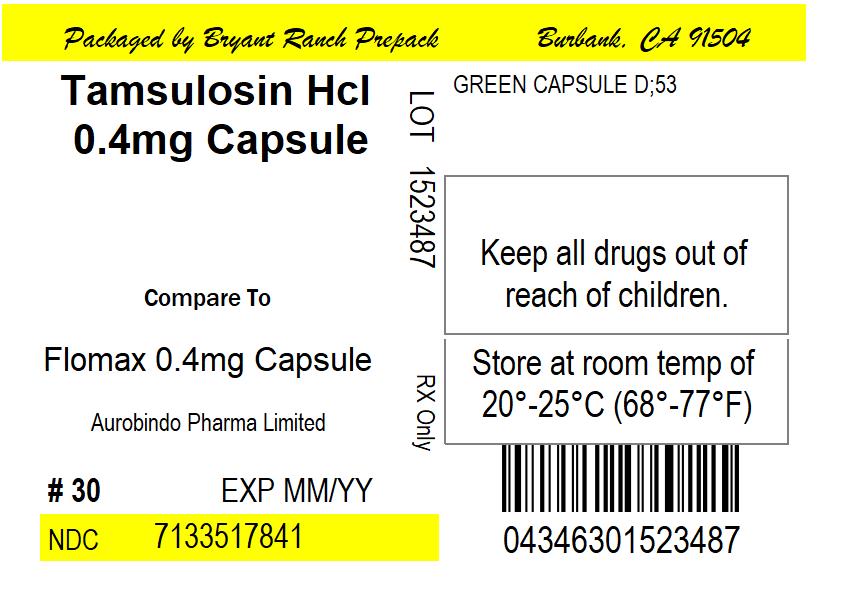
This is a description of a medication called Tamsulosin HCI, which comes in a green capsule with the imprint "D;53". Each capsule contains 0.4mg of the medication and is manufactured by Aurobindo Pharma Limited. The medication is commonly used as treatment for prostate gland enlargement. The packaging displays important information about proper storage and keeping this medication out of reach of children. The product is sold in a bottle of 30 capsules and is identified by the NDC number 7133517841 and 04346301523487.*
The text is a figure description and does not provide enough information to generate a useful description.*
Figure 2B represents a graph showing the mean change from baseline in the Total AUA Symptom Score (ranging from 0 to 35) in Study 2. It illustrates the mean change in the scores of patients who received treatment with different doses of a drug (0.08mg and 0.4mg) and placebo over a period of 13 weeks, as well as the LOCF (Last Observation Carried Forward).*
This appears to be a section of a scientific study indicating the increase in peak urine flow rate as a result of a particular treatment compared to a placebo. The treatment listed is 25 -O—O-—0-08mg -A-=A=2x 0.4mg. The study involved multiple groups (n=635, n=621, n=617, n=754, n=755, n=752, n=713, n=694) and different durations of treatment (measured in weeks). The figures suggest that the treatment resulted in a significant increase in peak urine flow rate compared to the placebo.*
The figure shows the mean increase in peak urine flow rate (mL/Sec) for Study 2. The duration of treatment in weeks is plotted on the x-axis, while the treatment type is represented by different markers on the graph. However, without additional information, it is not possible to provide a more detailed or complete description of the study or its results.*
* The product label images have been analyzed using a combination of traditional computing and machine learning techniques. It should be noted that the descriptions provided may not be entirely accurate as they are experimental in nature. Use the information in this page at your own discretion and risk.