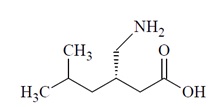
Pregabalin Capsule
Product Images NDC 71335-1822

15 FDA label images from Bryant Ranch Prepack · Packaging, Regulatory Labels, and Product Appearance

Product Visual Gallery

This gallery contains 15 technical images submitted to the FDA as part of the official labeling for Pregabalin (NDC 71335-1822). Unlike standard consumer photos, these assets often include clinical data figures, molecular chemical structures, and official manufacturer packaging layouts.

As provided by Bryant Ranch Prepack, these visuals offer a comprehensive scientific overview of the product's physical and chemical identity, aiding pharmacists and researchers in product verification and study.

FDA Label Image

Label (Lbl713351822)
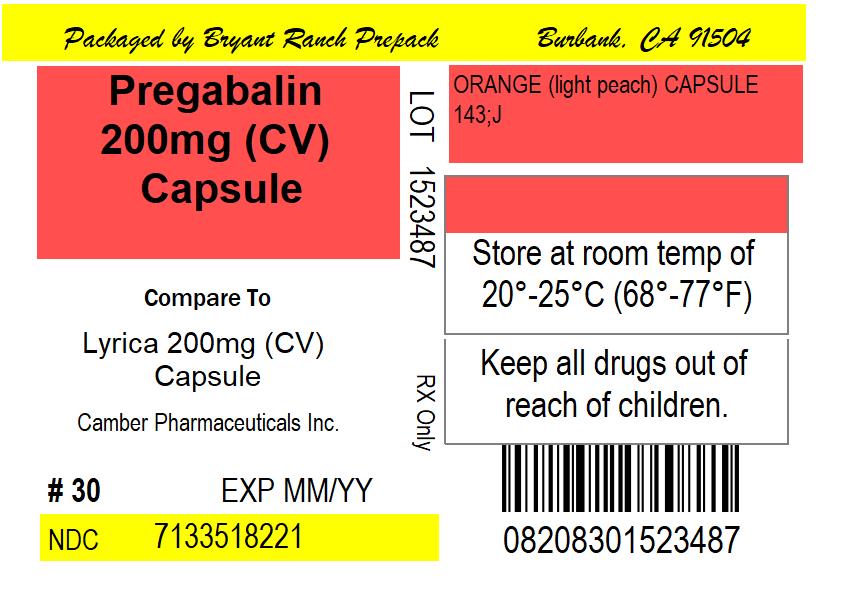
Label (Lbl713351822)
Pregabalin 200 mg capsule label by Bryant Ranch Prepack. The label indicates it is an oral capsule in orange (light peach) color, packaged in a quantity of 30, with storage instructions at room temperature (20°-25°C). It compares to Lyrica 200 mg by Camber Pharmaceuticals Inc. The label includes the product NDC 71335-1822, lot number 1523487, and barcode with accompanying caution to keep out of reach of children.*
FDA Label Image

Label (Lbl7133518222)

Label (Lbl7133518222)
Pregabalin Capsules, USP 200 mg oral capsules label by Bryant Ranch Prepack. The label shows 30 capsules per package, the NDC 71335-1822-01, and storage instructions. The label includes the Bryant Ranch Prepack logo and states prescription use only.*
FDA Label Image
FDA Label Image

Pregabalinfigure1 (Pregabalinfigure1)

Pregabalinfigure1 (Pregabalinfigure1)
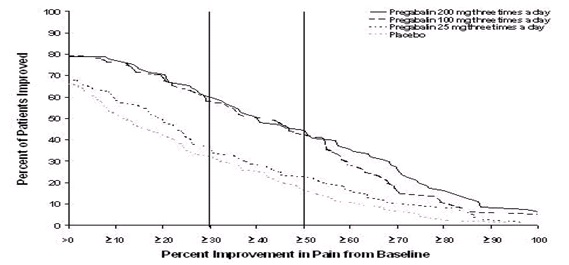
A line graph showing the percent of patients improved relative to percent improvement in pain from baseline. It compares Pregabalin at 200 mg, 100 mg, and 25 mg taken three times a day, plus a placebo group. The x-axis represents percent improvement in pain, and the y-axis represents the percent of patients improved.*
FDA Label Image

Pregabalinfigure10 (Pregabalinfigure10)

Pregabalinfigure10 (Pregabalinfigure10)
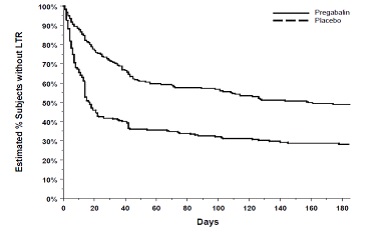
A line graph comparing the estimated percentage of subjects without LTR over time in days between Pregabalin and Placebo groups. The x-axis represents days up to 180, and the y-axis shows the percentage of subjects ranging from 0% to 100%. Two lines depict the outcomes for Pregabalin and Placebo.*
FDA Label Image

Pregabalinfigure11 (Pregabalinfigure11)

Pregabalinfigure11 (Pregabalinfigure11)
A line graph depicting the percent of subjects improved over time, comparing Pregabalin and Placebo from baseline to Week 12. The x-axis shows the percent improvement, and the y-axis shows the percent of subjects improved. The graph indicates greater improvement for Pregabalin compared to Placebo across the measured period.*
FDA Label Image

Pregabalinfigure12 (Pregabalinfigure12)

Pregabalinfigure12 (Pregabalinfigure12)
A line graph comparing the percentage of subjects improved over time from baseline to Week 16 BOCF for Pregabalin versus Placebo. The y-axis shows percent improvement of subjects, and the x-axis displays percent improved from baseline, highlighting the efficacy trends of both treatments.*
FDA Label Image

Pregabalinfigure2 (Pregabalinfigure2)

Pregabalinfigure2 (Pregabalinfigure2)
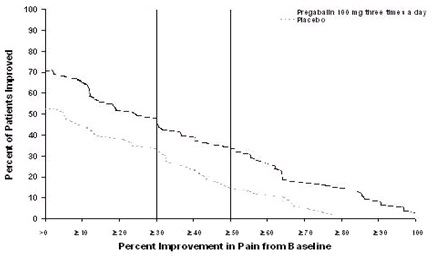
A line graph showing the percent of patients improved on the y-axis versus percent improvement in pain from baseline on the x-axis. The graph compares Pregabalin 100 mg taken three times a day with placebo, demonstrating higher patient improvement for Pregabalin across the range of pain improvement percentages.*
FDA Label Image

Pregabalinfigure3 (Pregabalinfigure3)

Pregabalinfigure3 (Pregabalinfigure3)
A line graph showing the percent of patients improved on the vertical axis and percent improvement in pain from baseline on the horizontal axis. The graph compares the effects of Pregabalin at doses of 75 mg, 150 mg, and 300 mg taken twice a day with a placebo over varying levels of pain improvement.*
FDA Label Image

Pregabalinfigure4 (Pregabalinfigure4)

Pregabalinfigure4 (Pregabalinfigure4)
A line graph comparing the percent of patients improved versus percent improvement in pain from baseline for Pregabalin 200 mg three times a day, Pregabalin 100 mg three times a day, and placebo. The vertical axis shows percent of patients improved, and the horizontal axis shows percent improvement in pain from baseline.*
FDA Label Image

Pregabalinfigure5 (Pregabalinfigure5)

Pregabalinfigure5 (Pregabalinfigure5)
A line graph showing the percent of patients improved on the y-axis versus percent improvement in pain from baseline on the x-axis. The graph compares three groups: Pregabalin 100 mg three times a day, Pregabalin 50 mg three times a day, and placebo, illustrating their respective pain improvement profiles.*
FDA Label Image

Pregabalinfigure6 (Pregabalinfigure6)

Pregabalinfigure6 (Pregabalinfigure6)
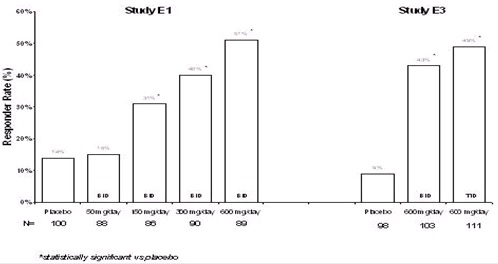
A bar chart depicting responder rates (%) in two studies (E1 and E3) comparing placebo and various dosages (600 mg/day, 300 mg/day, 150 mg/day) of a drug, likely pregabalin, showing higher responder rates for the drug versus placebo at different dosing schedules.*
FDA Label Image

Pregabalinfigure7 (Pregabalinfigure7)

Pregabalinfigure7 (Pregabalinfigure7)
A dose-response graph illustrating seizure reduction (median % change from baseline) against pregabalin dose (mg/day). The graph compares four study groups with different dosing schedules (BID and TID) and shows statistically significant seizure reduction at various doses.*
FDA Label Image

Pregabalinfigure9 (Pregabalinfigure9)

Pregabalinfigure9 (Pregabalinfigure9)
A line graph comparing percent improvement in pain from baseline versus percent of patients improved among groups receiving Pregabalin at 300 mg, 450 mg, and 600 mg daily doses and a placebo group. The X-axis shows percent improvement in pain from 0 to 100, and the Y-axis shows percent of patients improved from 0 to 100, with curves illustrating improved patient response across doses.*
FDA Label Image

Pregabalinstructure (Pregabalinstructure)

Pregabalinstructure (Pregabalinstructure)
Chemical structure of Pregabalin showing its molecular composition including amino, carboxyl, and alkyl groups characteristic of the active ingredient.*

* About these descriptions: Image descriptions on this page are generated by automated AI analysis of the product label images from the manufacturer's FDA label submission (SPL). They are provided for reference only and may contain errors or omissions. Always rely on the printed label itself and the official FDA labeling, and consult a pharmacist or healthcare professional with any questions about this product.