Aripiprazole Tablet
Product Images NDC 71335-1832

View Photos of Packaging, Regulatory Labels, and Product Appearance

Product Visual Gallery

This gallery contains 10 technical images submitted to the FDA as part of the official labeling for Aripiprazole (NDC 71335-1832). Unlike standard consumer photos, these assets often include clinical data figures, molecular chemical structures, and official manufacturer packaging layouts.

As provided by Bryant Ranch Prepack, these visuals offer a comprehensive scientific overview of the product's physical and chemical identity, aiding pharmacists and researchers in product verification and study.

FDA Label Image

Aripiprazole-fig-16.jpg (Aripiprazole Fig 16)
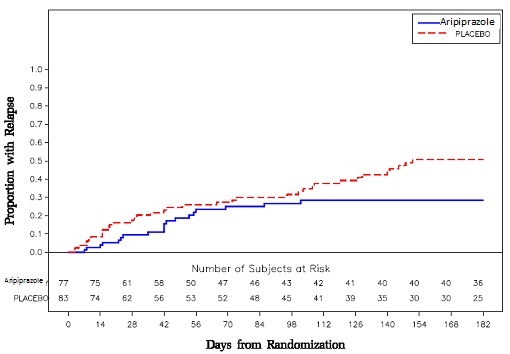
Aripiprazole-fig-16.jpg (Aripiprazole Fig 16)
A Kaplan-Meier survival curve chart comparing the proportion of subjects with relapse over time between Aripiprazole and placebo groups. The x-axis represents days from randomization, and the y-axis represents the proportion with relapse. The chart includes the number of subjects at risk for each group at various time points.*
FDA Label Image

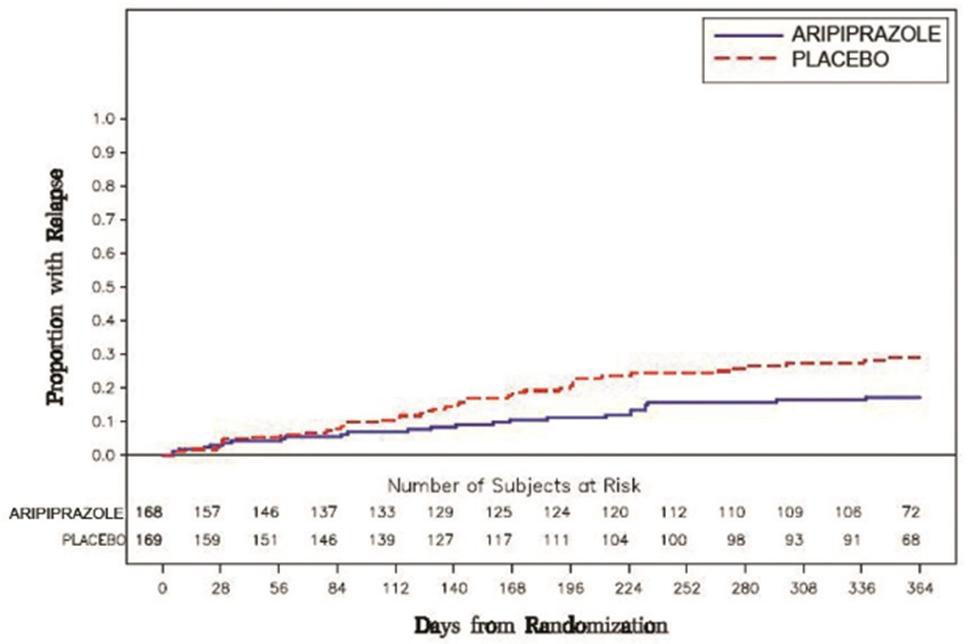
Aripiprazole-fig-17 (Aripiprazole Fig 17)

Aripiprazole-fig-17 (Aripiprazole Fig 17)
A Kaplan-Meier survival curve showing the proportion with relapse over days from randomization comparing Aripiprazole and placebo. The chart includes the number of subjects at risk for each group at multiple time points up to 364 days.*
FDA Label Image

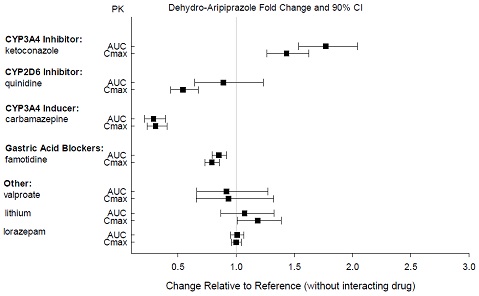
Effects Of Other Drugs On Dehydro-aripiprazole (Aripiprazole Fig10)

Effects Of Other Drugs On Dehydro-aripiprazole (Aripiprazole Fig10)
A pharmacokinetic chart showing the fold change and 90% confidence interval for dehydro-aripiprazole under the influence of various inhibitors and inducers. The x-axis represents change relative to a reference without interacting drug, and the y-axis lists interacting drugs including CYP3A4 inhibitor (ketoconazole), CYP2D6 inhibitor (quinidine), CYP3A4 inducer (carbamazepine), gastric acid blockers (famotidine), and others (valproate, lithium, lorazepam). Data points indicate changes in AUC and Cmax values.*
FDA Label Image

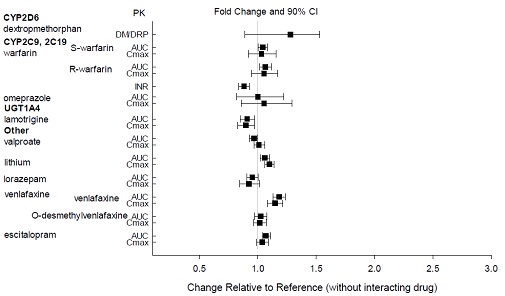
Effects Of Aripiprazole On Pharmacokinetics Of Other Drugs (Aripiprazole Fig11)

Effects Of Aripiprazole On Pharmacokinetics Of Other Drugs (Aripiprazole Fig11)
A forest plot chart showing the fold change and 90% confidence intervals for various drugs and enzymes (e.g., CYP2D6, CYP2C9, CYP2C19) relative to a reference without interacting drug. The chart plots pharmacokinetic parameters like AUC and Cmax, illustrating changes relative to control values for drugs such as warfarin, omeprazole, lamotrigine, valproate, lithium, lorazepam, venlafaxine, and escitalopram.*
FDA Label Image

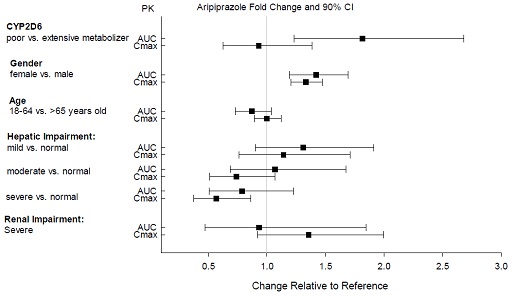
Effects Of Intrinsic Factors On Aripiprazole (Aripiprazole Fig12)

Effects Of Intrinsic Factors On Aripiprazole (Aripiprazole Fig12)
A pharmacokinetic chart depicting Aripiprazole fold change with 90% confidence intervals comparing various factors such as CYP2D6 metabolizer status, gender, age groups, hepatic impairment severity, and severe renal impairment. The X-axis represents change relative to reference, and the Y-axis shows AUC and Cmax parameters for each factor.*
FDA Label Image

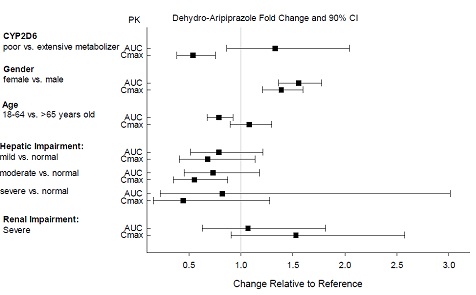
Effects Of Intrinsic Factors On Dehydro-aripiprazole (Aripiprazole Fig13)

Effects Of Intrinsic Factors On Dehydro-aripiprazole (Aripiprazole Fig13)
A scatter plot chart showing fold change and 90% confidence intervals for Dehydro-Aripiprazole pharmacokinetics. The chart compares variables such as CYP2D6 metabolizer status, gender, age groups, hepatic impairment severity, and severe renal impairment against AUC and Cmax, with changes relative to a reference value on the x-axis.*
FDA Label Image

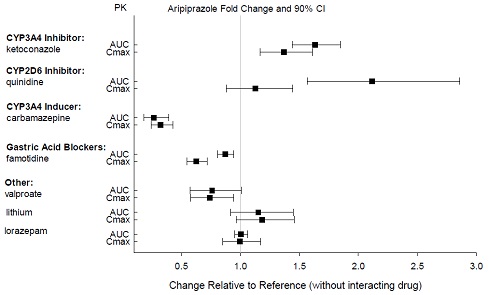
Effects Of Other Drugs On Aripiprazole (Aripiprazole Fig9)

Effects Of Other Drugs On Aripiprazole (Aripiprazole Fig9)
A pharmacokinetic chart showing Aripiprazole fold change and 90% confidence intervals for various interacting drugs. It plots changes in AUC and Cmax relative to a reference without interacting drugs, including CYP3A4 inhibitors (ketoconazole), CYP2D6 inhibitors (quinidine), CYP3A4 inducers (carbamazepine), gastric acid blockers (famotidine), and other drugs like valproate, lithium, and lorazepam.*
FDA Label Image

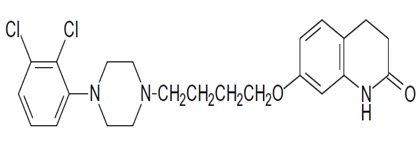
Aripiprazole Structure (Aripiprazole Fig8)

Aripiprazole Structure (Aripiprazole Fig8)
Chemical structure diagram of aripiprazole, showing its molecular framework including chlorinated aromatic rings, a piperazine ring, and a quinolinone moiety, corresponding to the active ingredient aripiprazole.*
FDA Label Image

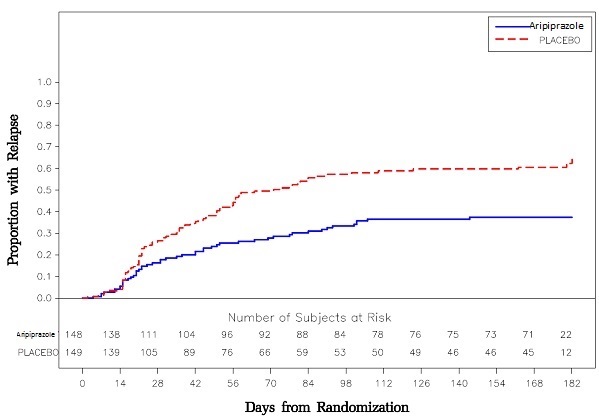
Aripiprazole-graph (Aripiprazole Graph)

Aripiprazole-graph (Aripiprazole Graph)
A Kaplan-Meier plot showing the proportion with relapse over days from randomization, comparing Aripiprazole and placebo. The x-axis indicates days from randomization up to 182, and the y-axis shows the proportion with relapse from 0 to 1. The graph includes a risk table displaying the number of subjects at risk at various time points for both Aripiprazole and placebo groups.*
FDA Label Image

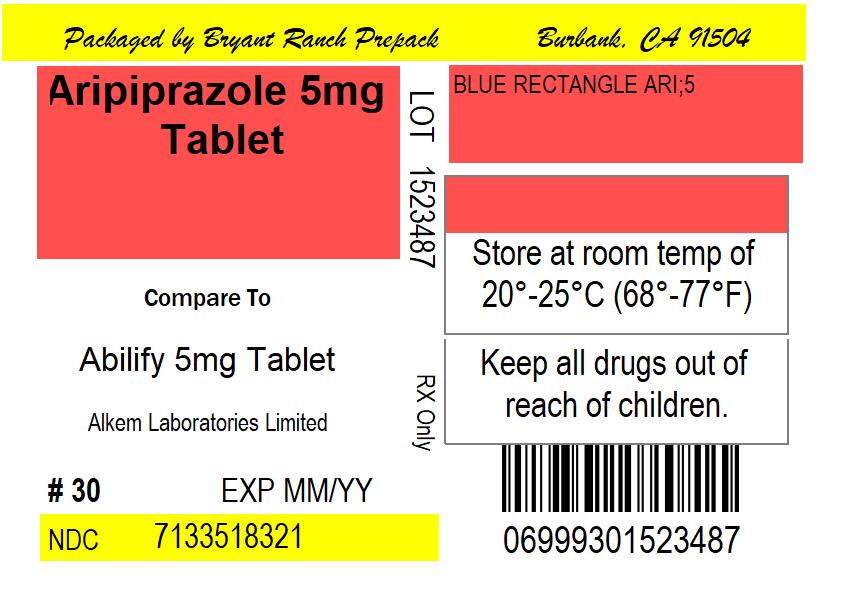
Label (Lbl713351832)

Label (Lbl713351832)
Aripiprazole 5 mg tablet label packaged by Bryant Ranch Prepack in Burbank, CA. The label compares to Abilify 5 mg tablet by Alkem Laboratories Limited. It indicates a quantity of 30 tablets, room temperature storage instructions (20-25°C), and a barcode with NDC 71335-1832-1.*

* About these descriptions: Image descriptions on this page are generated by automated AI analysis of the product label images from the manufacturer's FDA label submission (SPL). They are provided for reference only and may contain errors or omissions. Always rely on the printed label itself and the official FDA labeling, and consult a pharmacist or healthcare professional with any questions about this product.