Memantine Hydrochloride
Product Images NDC 71335-1863
View Photos of Packaging, Regulatory Labels, and Product Appearance
Product Visual Gallery
This gallery contains 11 technical images submitted to the FDA as part of the official labeling for Memantine Hydrochloride (NDC 71335-1863). Unlike standard consumer photos, these assets often include clinical data figures, molecular chemical structures, and official manufacturer packaging layouts.
As provided by Bryant Ranch Prepack, these visuals offer a comprehensive scientific overview of the product's physical and chemical identity, aiding pharmacists and researchers in product verification and study.
Product Images & Figures Index
Label (Lbl713351863)
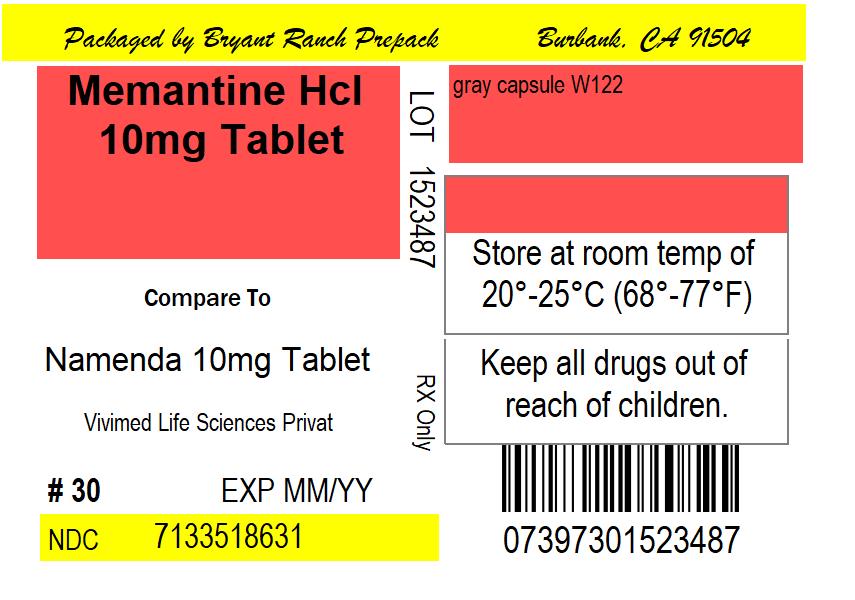
This is a description of a medication called "Namenda" with a dosage of 10mg per tablet. The medication has been packaged by a company called "Bryant Ranck Prepack" and compared to a similar medication made by "Vivimed Life Sciences Private." The package contains 30 tablets, and the expiration date is indicated by "EXP MM/YY." The National Drug Code (NDC) for the medication is 7133518631. The medication should be stored at room temperature, and caution must be taken to keep it out of reach of children. There is a barcode number present as well.*
Structure (Memantinehcltab Figure 01)

Figure1 (Memantinehcltab Figure 02)
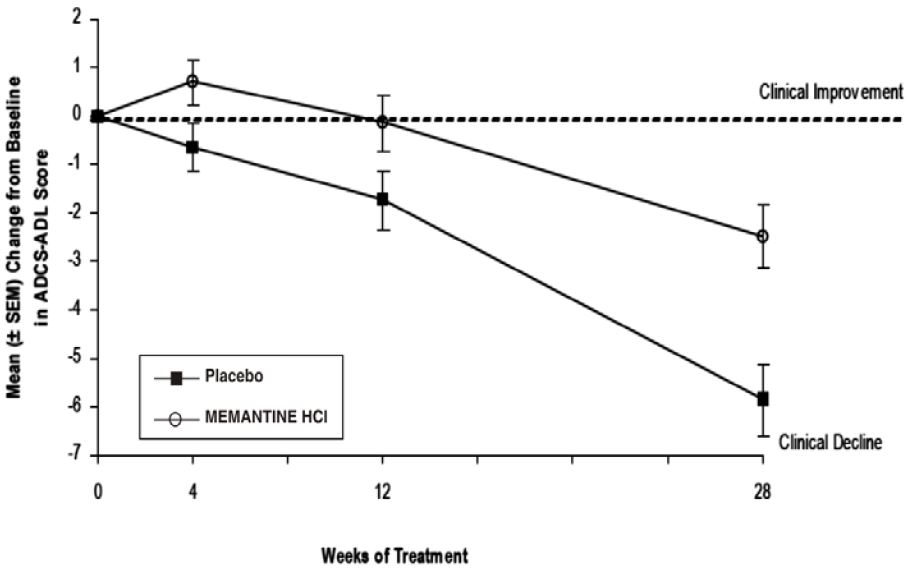
The given text appears to be a table, showing the mean change (and SEM) in ADCS-ADL score after 12 weeks of treatment with either placebo or memantine HCl. The table also indicates that there was clinical improvement in both groups (however, without any specific numeric values).*
Figure2 (Memantinehcltab Figure 03)
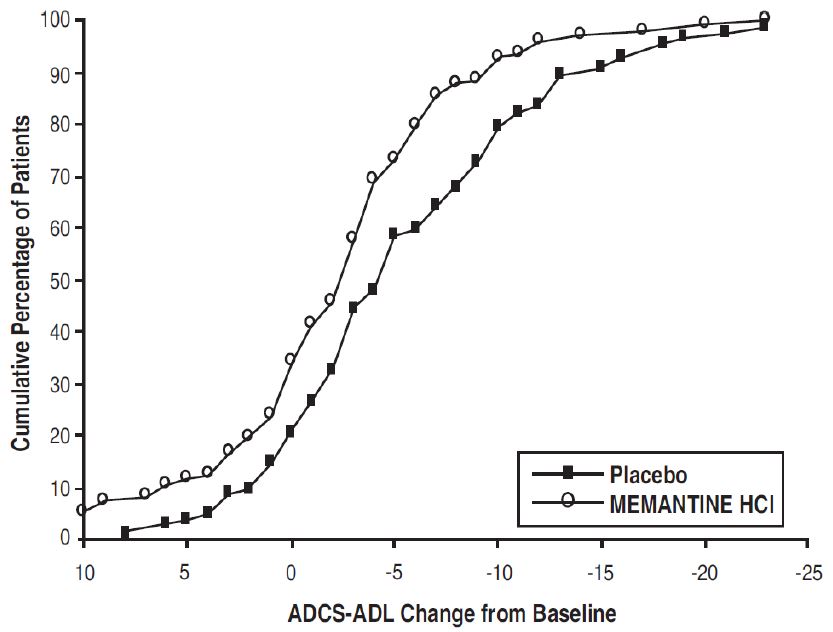
This appears to be a chart or graph displaying the cumulative percentage of patients and their ADCS-ADL Change from Baseline, with two lines for the drugs Placebo and Memantine HCI. The x-axis shows negative values for change from baseline, indicating a decline in patient function, while the y-axis displays percentages from 0 to 100. However, without more context or information, the purpose of this graph is not entirely clear.*
Figure3 (Memantinehcltab Figure 04)
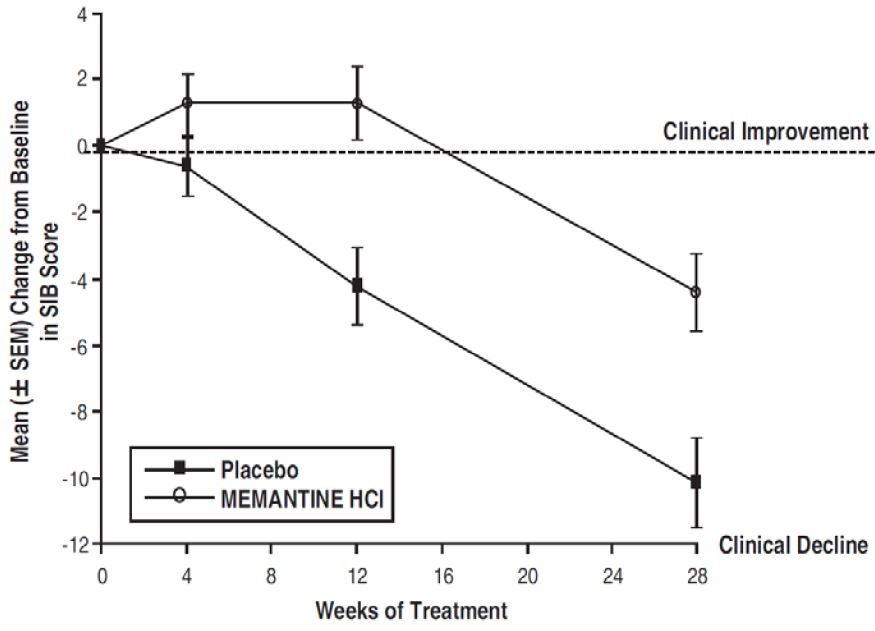
Figure4 (Memantinehcltab Figure 05)

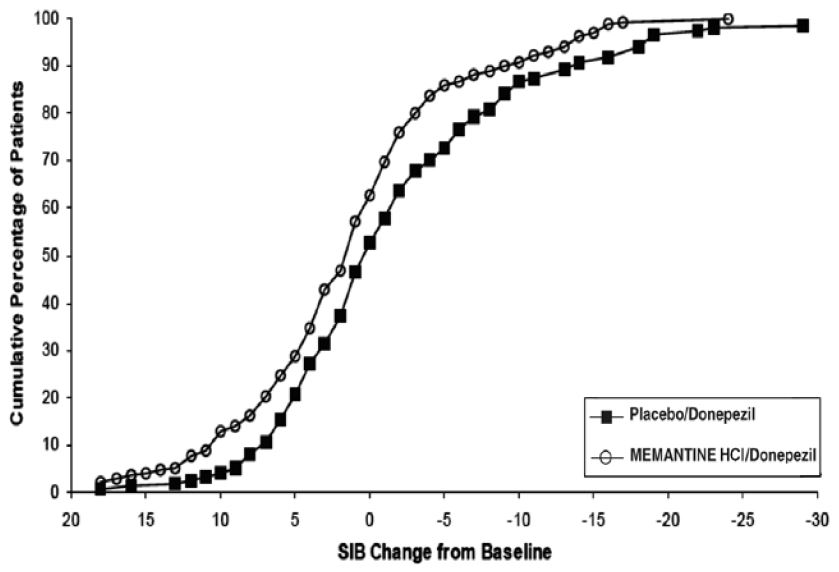
This appears to be a chart or graph showing the cumulative percentage of patients and their response to a placebo and memantine HCI in relation to a change from baseline. The x-axis likely represents the percentage of patients and the y-axis represents the change from baseline. Without more context or a clearer image, further analysis or interpretation is not possible.*
Figure5 (Memantinehcltab Figure 06)
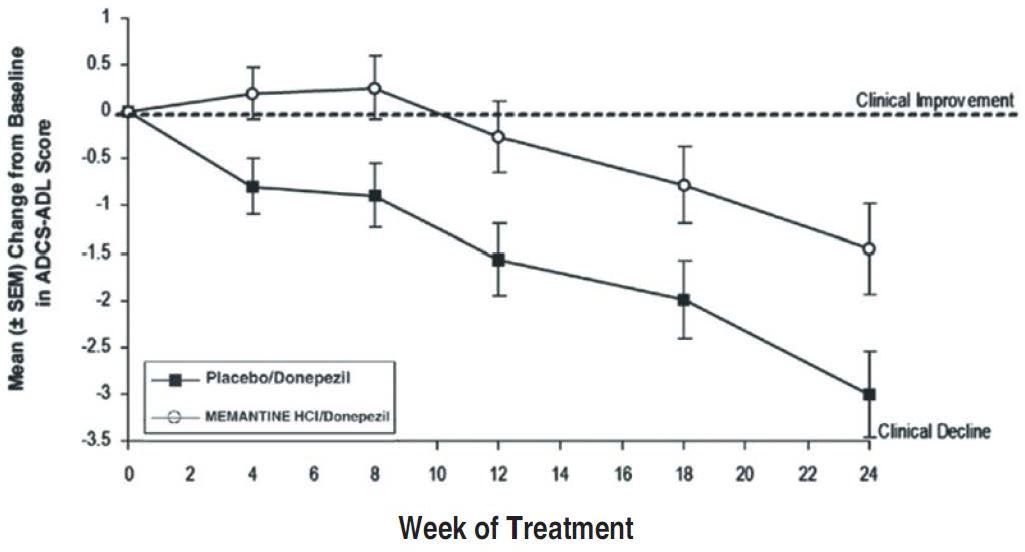
Figure6 (Memantinehcltab Figure 07)
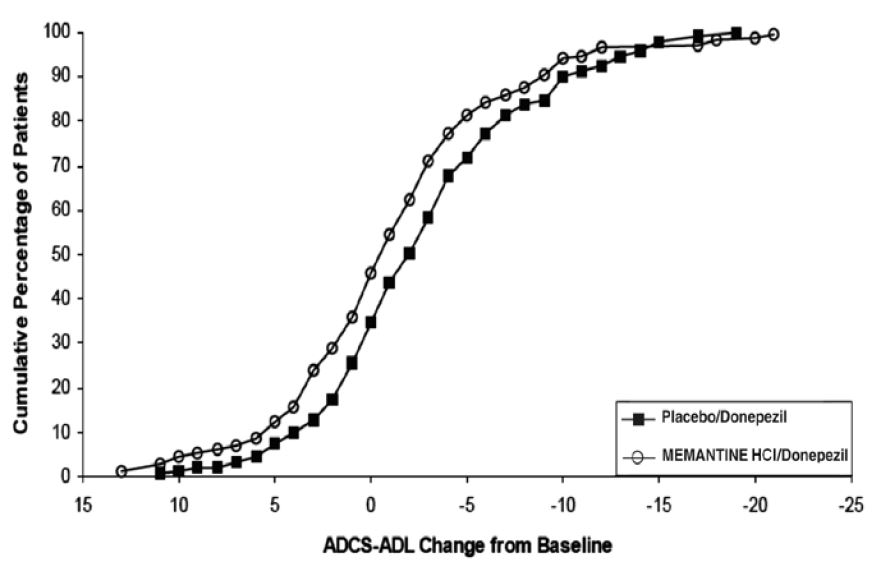
Figure7 (Memantinehcltab Figure 08)
Figure8 (Memantinehcltab Figure 09)
* These product label images have been analyzed using experimental machine learning. Please verify findings with the primary label text.