Memantine-figure1 (Memantine Figure1)

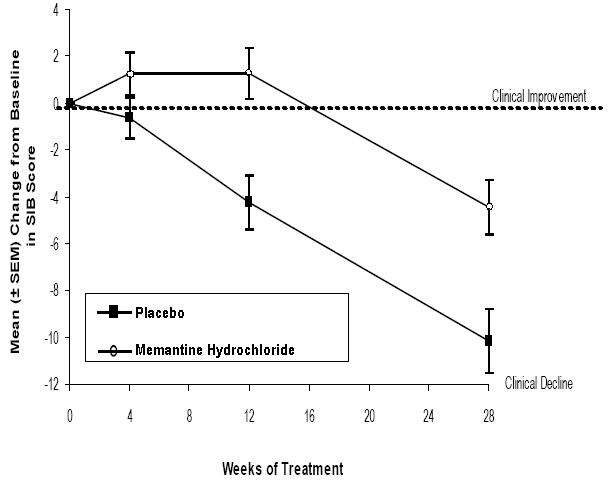
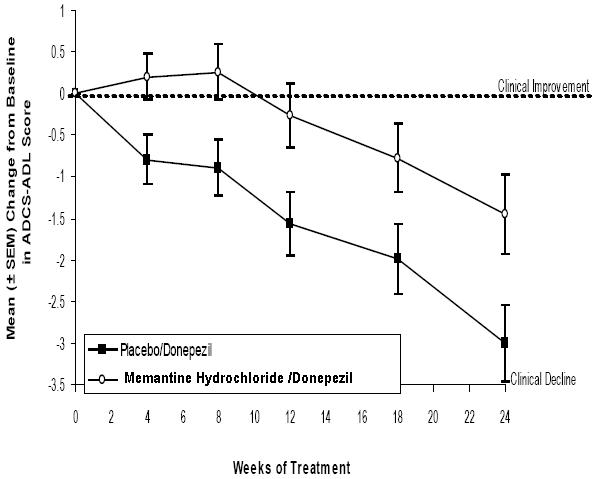
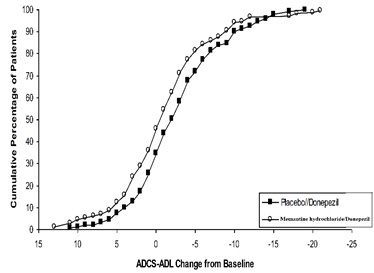
The text is describing a graph or chart showing the mean change from baseline in ADCS-ADL score over 12 weeks of treatment with either a placebo or memantine hydrachloride. It appears that there may be improvement with memantine hydrachloride and a decline with placebo, based on the "Clinical Degline" notation. SEM is used to represent standard error of mean.*