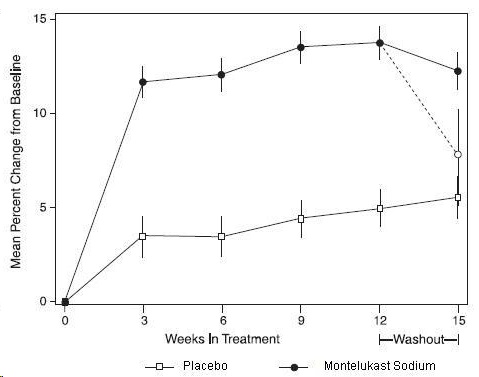
Figure 1 (Ecb8c513 E5ee 4501 A240 B2d644615559 01)

This text appears to be a chart or graph displaying the Change in Height (cm) over Weeks on Treatment for three different medications: Montelukast Sodium 5 mg, Boclomethasone 336 mog, and a Placabo. The x-axis shows the Weeks on Treatment (in increments of 8) and the y-axis shows the change in height in centimeters. However, without a clear visualization, it is difficult to interpret the data accurately.*