Gaba-fig-1-jpg.jpg (Gaba Fig 1 Jpg)
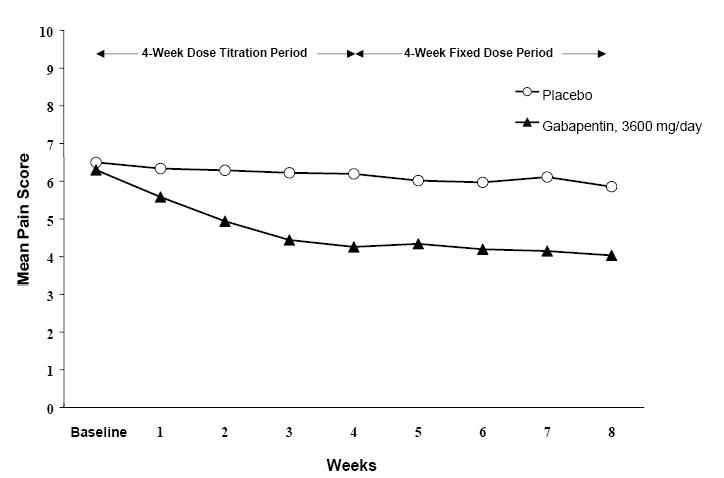
This is a chart showing the mean pain score over a period of 4 weeks, divided into a dose titration period and a fixed dose period. The chart includes data for a placebo group and a group taking Gabapentin at a dosage of 3600 mg/day. The pain scores range from 0 to 10 and are plotted over a period of 4 weeks. No other information or context is available.*