Losartan Potassium Tablet, Film Coated
Product Images NDC 71335-2083

View Photos of Packaging, Regulatory Labels, and Product Appearance

Product Visual Gallery

This gallery contains 6 technical images submitted to the FDA as part of the official labeling for Losartan Potassium (NDC 71335-2083). Unlike standard consumer photos, these assets often include clinical data figures, molecular chemical structures, and official manufacturer packaging layouts.

As provided by Bryant Ranch Prepack, these visuals offer a comprehensive scientific overview of the product's physical and chemical identity, aiding pharmacists and researchers in product verification and study.

FDA Label Image

Label (Lbl713352083)

Label (Lbl713352083)
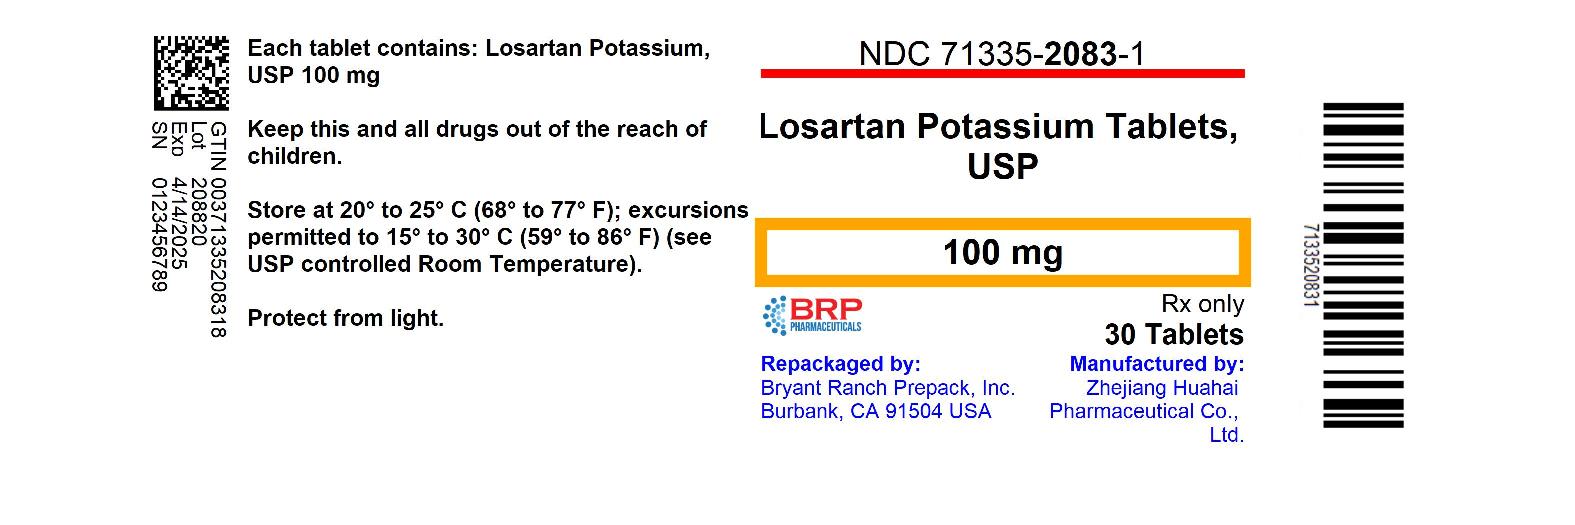
This is a description of Losartan Potassium Tablets containing 100mg of Losartan Potassium. The drug is to be kept away from children and protected from light. The tablets should be stored at 20°C to 25°C and excursions permitted to 15°C to 30°C. The product is repackaged by Bryant Ranch Prepack and manufactured by Zhejiang Huahai Pharmaceutical Co., Ltd.*
FDA Label Image

Chemical Structure (Spl Image1 Structure1)

FDA Label Image

Figure 1 (Spl Image2 Figure1)

Figure 1 (Spl Image2 Figure1)
This is a comparison of two medications, Atenolol and Losartan Potassium, in terms of their effectiveness for reducing the primary endpoint in patients. The data shows an adjusted risk reduction of 13% with a p-value of 0.021. There is also a graph showing the study months from 0 to 66.*
FDA Label Image

Figure 2 (Spl Image3 Figure2)

Figure 2 (Spl Image3 Figure2)
This text is presenting the comparison of the risk reduction rates of Atenolol and Losartan Potassium in patients with the percentage of fatal/non-fatal stroke along with time in months. The adjusted risk reduction is 25%, which is statistically significant with a p-value of 0.001. The percentage of patients with stroke is presented over time for a study, in increments of 6 months up to 66 months.*
FDA Label Image

Figure 3 (Spl Image4 Figure3)

Figure 3 (Spl Image4 Figure3)
The text describes a table labeled "Figure 3" with data on the primary endpoint events within demographic subgroups for patients taking Losartan Potassium and Atenolol. The table includes information on the number of events, rates, and hazard ratios (including 95% confidence intervals) for different subgroups, such as age, gender, race, ISH status, diabetes, and history of CVD. The table also includes notes on the symbols used and how the data were adjusted.*
FDA Label Image

Figure 4 (Spl Image5 Figure4)

Figure 4 (Spl Image5 Figure4)
This is a graph that compares the effectiveness of Losartan Potassium versus Placebo in reducing risk for patients with an event over 48 months. The vertical axis indicates the percentage of patients with an event, while the horizontal axis represents the duration of the study in months. It shows that Losartan Potassium was more effective in reducing the risk of an event, with a risk reduction of 16.1%. The statistical significance is indicated by the p-value of 0.022.*

* These product label images have been analyzed using experimental machine learning. Please verify findings with the primary label text.