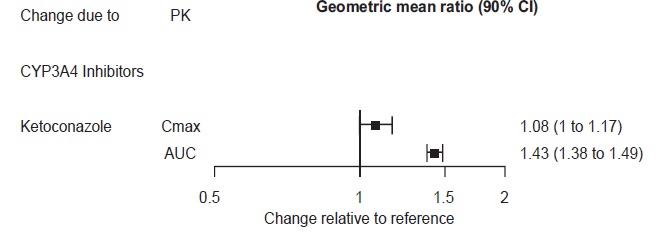
Product Images Desvenlafaxine

View Photos of Packaging, Labels & Appearance

Product Label Images

The following 7 images provide visual information about the product associated with Desvenlafaxine NDC 71335-2130 by Bryant Ranch Prepack, such as packaging, labeling, and the appearance of the drug itself. This resource could be helpful for medical professionals, pharmacists, and patients seeking to verify medication information and ensure they have the correct product.

Figure 1 - desvenlafaxine figure1

Figure 1 - desvenlafaxine figure1

This text provides pharmacokinetic information on the effect of renal and hepatic impairment, as well as gender and age, on a certain drug. The geometric mean ratios for Cmax and AUC values are given for mild, moderate, severe, and ESRD renal impairment, as well as for hepatic impairment. Additionally, the effect of gender and age on Cmax and AUC values is also provided. The text is suitable for pharmacologists or healthcare professionals who are interested in the pharmacokinetics of the drug under consideration.*

Figure 2 - desvenlafaxine figure2

Figure 2 - desvenlafaxine figure2

This appears to be a table related to changes in CYP3A4 inhibitors caused by the administration of Ketoconazole. The table displays data on the geometric mean ratio of the maximum concentration (Cmax) and area under the curve (AUC) for Ketoconazole, with respect to a reference value. However, it is not clear what the reference value is or what the units of measurement are.*

Figure 3 - desvenlafaxine figure3

Figure 3 - desvenlafaxine figure3

Figure 4 - desvenlafaxine image4

Figure 4 - desvenlafaxine image4

The text describes a graph that shows the estimated proportion of patients with relapse over a period of time. The x-axis represents the time to relapse in days and the y-axis shows the percentage of patients with relapse. The graph compares two treatments: Desvenlafarine Extended-Release Tablets 50mg and a Placebo. The graph shows that the percentage of patients with relapse is lower for Desvenlafarine Extended-Release Tablets at all time points.*

Figure 5 - desvenlafaxine image5

Figure 5 - desvenlafaxine image5

This appears to be a graph showing the estimated proportion of patients with relapse, with the x-axis labeled as "Time to relapse" in days and the y-axis labeled as an estimated percentage of patients. The graph also shows the comparison between Desvenlafaxine Extended-Release Tablets and a placebo, with Desvenlafaxine showing a lower estimated proportion of patients with relapse over time.*

Structure - desvenlafaxine structure1

Structure - desvenlafaxine structure1

This appears to be a chemical structure diagram consisting of the chemical symbols for two hydrogen atoms, followed by one carbon atom, and finally two oxygen atoms. It likely represents a molecule or compound composed of these atoms.*

Label - lbl713352130

Label - lbl713352130

* The product label images have been analyzed using a combination of traditional computing and machine learning techniques. It should be noted that the descriptions provided may not be entirely accurate as they are experimental in nature. Use the information in this page at your own discretion and risk.