Figure 1 (Divalproex Fig1)

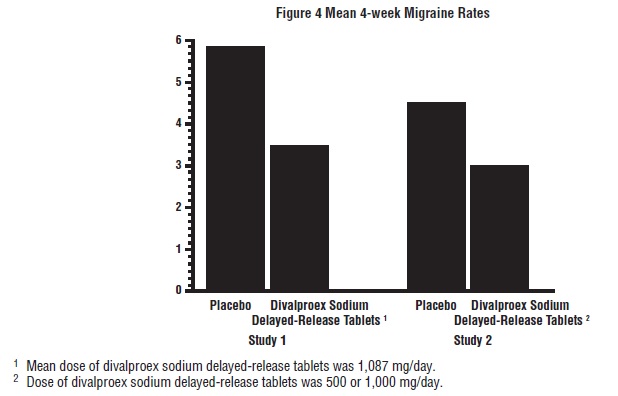
The text appears to be a figure caption showing the results of two studies, represented by a chart or graph labeled "Figure 1". The studies are referred to as "Study 1" and "Study 2" and are measured in "YRS" and "WIRS", respectively. There is an indication of statistical significance, with "*p<0.05" suggesting a significant difference between groups. The letters "PBO", "DVPK", "P80", and "DVPX" are also included, with "PBO" representing a placebo and "DVPX" representing divalproex sodium delayed-release tablets, while the meanings of "DVPK" and "P80" are not clear from the text.*