Vardenafil Hydrochloride Tablet, Film Coated
Product Images NDC 71335-2357

View Photos of Packaging, Regulatory Labels, and Product Appearance

Product Visual Gallery

This gallery contains 10 technical images submitted to the FDA as part of the official labeling for Vardenafil Hydrochloride (NDC 71335-2357). Unlike standard consumer photos, these assets often include clinical data figures, molecular chemical structures, and official manufacturer packaging layouts.

As provided by Bryant Ranch Prepack, these visuals offer a comprehensive scientific overview of the product's physical and chemical identity, aiding pharmacists and researchers in product verification and study.

FDA Label Image

Label (Lbl713352357)

Label (Lbl713352357)
Label for Vardenafil Hydrochloride 20 mg film-coated tablets, oral. The label shows the NDC 71335-2357-1, indicates the package contains 30 tablets, repackaged by Bryant Ranch Prepack and manufactured by Alembic Pharmaceuticals Limited. Storage instructions and child-resistant container requirements are also visible.*
FDA Label Image

Figure 1 (Vardenafil Figure1)

Figure 1 (Vardenafil Figure1)
A set of three line graphs showing mean maximal changes in systolic blood pressure, diastolic blood pressure, and heart rate (bpm) at different time points before Nitroglycerin treatment following Vardenafil administration. The x-axes represent timing intervals (24h, 8h, 4h, 1h), and the y-axes indicate changes in mmHg for blood pressure and bpm for heart rate, with error bars for variability.*
FDA Label Image

Figure 2 (Vardenafil Figure2)

Figure 2 (Vardenafil Figure2)
A line graph depicting mean change in mmHg over time (hours) for placebo and vardenafil 5 mg under simultaneous and 6-hour separation conditions. The x-axis represents time in hours (0 to 6), and the y-axis shows mean change in mmHg (-15 to 15). Four lines display data for placebo (simultaneous and 6-hour separation) and vardenafil 5 mg (simultaneous and 6-hour separation).*
FDA Label Image

Figure 3 (Vardenafil Figure3)

Figure 3 (Vardenafil Figure3)
A line graph depicting mean change in mmHg over 6 hours for placebo and vardenafil 5 mg under simultaneous and 6-hour separation conditions. The y-axis represents mean change in mmHg, while the x-axis shows time in hours. Four lines track the effects for each condition across the time course.*
FDA Label Image

Figure 4 (Vardenafil Figure4)

Figure 4 (Vardenafil Figure4)
A line graph showing mean change in mmHg (y-axis) over time in hours (x-axis) for placebo and vardenafil 10 mg and 20 mg groups. The graph includes two placebo stages and compares blood pressure changes across six hours post-dosing.*
FDA Label Image

Figure 5 (Vardenafil Figure5)

Figure 5 (Vardenafil Figure5)
A line graph depicting mean change in mmHg over 6 hours with data points for placebo (Stage 1 and Stage 2) and Vardenafil at 5 mg and 10 mg doses. The y-axis shows mean change in mmHg from -10 to 10, while the x-axis represents time in hours from 0 to 6, indicating blood pressure changes for these groups over time.*
FDA Label Image

Figure 6 (Vardenafil Figure6)

Figure 6 (Vardenafil Figure6)
A line graph showing mean change in mmHg over time (hours) comparing placebo and two doses (10 mg, 20 mg) of Vardenafil administered either 6 hours apart or simultaneously. The graph includes multiple lines depicting blood pressure changes over a 6-hour period under each condition, with the title 'TERAZOSIN'.*
FDA Label Image

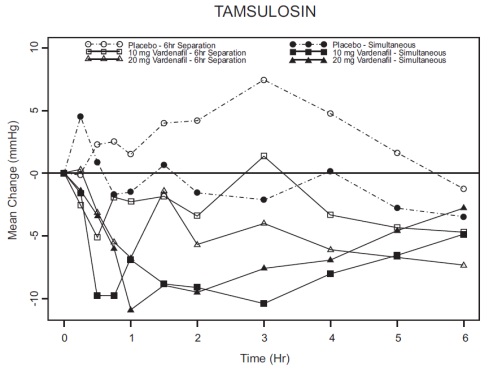
Figure 7 (Vardenafil Figure7)

Figure 7 (Vardenafil Figure7)
A line graph titled 'TAMSULOSIN' showing mean change in mmHg on the y-axis over time in hours (0 to 6) on the x-axis. The graph compares Placebo, 10 mg Vardenafil, and 20 mg Vardenafil under two conditions: 6-hour separation and simultaneous administration, with distinct markers and lines for each treatment group.*
FDA Label Image

Figure 8 (Vardenafil Figure8)

Figure 8 (Vardenafil Figure8)
A pharmacokinetic line graph showing plasma concentration (µg/L) of Vardenafil Hydrochloride over time (hours). The graph illustrates a peak plasma concentration followed by a gradual decline from 0 to 24 hours, with error bars indicating variability at each time point.*
FDA Label Image

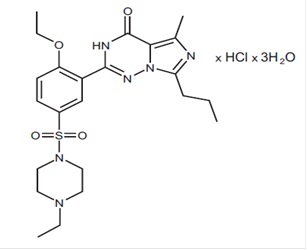
Structure (Vardenafil Str)

Structure (Vardenafil Str)
Chemical structure diagram of Vardenafil Hydrochloride depicting molecular components including atoms and bonds, with notation indicating the presence of hydrochloride and hydration (3 water molecules).*

* About these descriptions: Image descriptions on this page are generated by automated AI analysis of the product label images from the manufacturer's FDA label submission (SPL). They are provided for reference only and may contain errors or omissions. Always rely on the printed label itself and the official FDA labeling, and consult a pharmacist or healthcare professional with any questions about this product.