Leflunomide Tablet, Film Coated
Product Images NDC 71335-2403

View Photos of Packaging, Regulatory Labels, and Product Appearance

Product Visual Gallery

This gallery contains 7 technical images submitted to the FDA as part of the official labeling for Leflunomide (NDC 71335-2403). Unlike standard consumer photos, these assets often include clinical data figures, molecular chemical structures, and official manufacturer packaging layouts.

As provided by Bryant Ranch Prepack, these visuals offer a comprehensive scientific overview of the product's physical and chemical identity, aiding pharmacists and researchers in product verification and study.

FDA Label Image

Image (B9ae0559 441f 4be3 88e5 336b2bbfa2b2 01)

Image (B9ae0559 441f 4be3 88e5 336b2bbfa2b2 01)
Chemical structure diagram showing the molecular formula of leflunomide, displaying its characteristic rings and functional groups including a trifluoromethyl (CF3) substituent, an amide linkage (CO-NH), and a methyl group (CH3).*
FDA Label Image

Image (B9ae0559 441f 4be3 88e5 336b2bbfa2b2 02)

Image (B9ae0559 441f 4be3 88e5 336b2bbfa2b2 02)
Chemical structure of teriflunomide, depicted as A77 1726 in the image, showing its molecular formula with labeled functional groups and ring structures.*
FDA Label Image

Image (B9ae0559 441f 4be3 88e5 336b2bbfa2b2 03)

Image (B9ae0559 441f 4be3 88e5 336b2bbfa2b2 03)
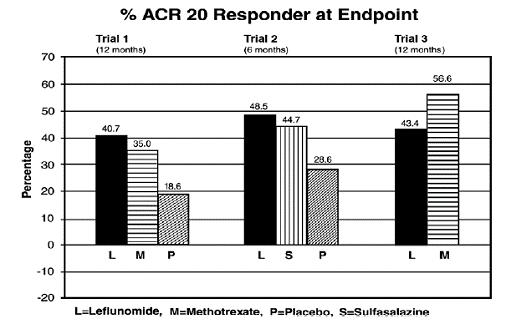
A bar chart titled '% ACR 20 Responder at Endpoint' showing response percentages across three clinical trials of varying lengths (6 and 12 months). The chart compares leflunomide (L), methotrexate (M), placebo (P), and sulfasalazine (S) treatments, labeled on the X-axis, with percentage responses on the Y-axis ranging from -20 to 70 percent.*
FDA Label Image

Image (B9ae0559 441f 4be3 88e5 336b2bbfa2b2 04)

Image (B9ae0559 441f 4be3 88e5 336b2bbfa2b2 04)
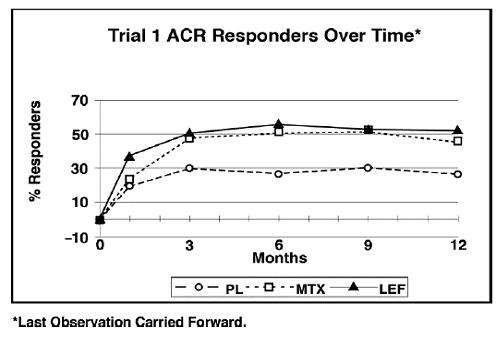
Line graph titled 'Trial 1 ACR Responders Over Time' showing percentage of responders over 12 months for three groups: PL (placebo), MTX (methotrexate), and LEF (leflunomide). The y-axis represents percentage responders (ranging from -10 to 70%), and the x-axis represents time in months (0 to 12). Leflunomide (LEF) group consistently shows the highest percentage of responders throughout the timeline.*
FDA Label Image

Image (B9ae0559 441f 4be3 88e5 336b2bbfa2b2 05)

Image (B9ae0559 441f 4be3 88e5 336b2bbfa2b2 05)
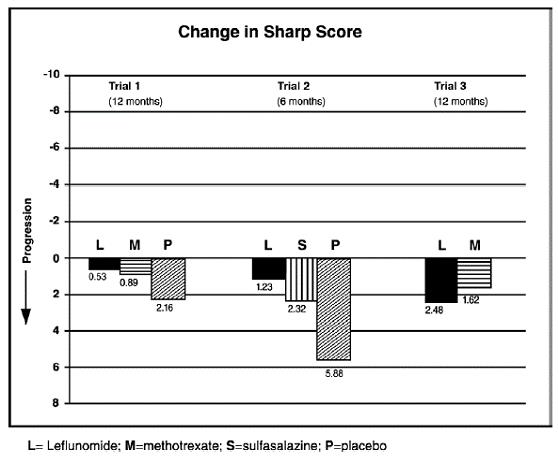
A bar chart titled 'Change in Sharp Score' depicting data from three clinical trials comparing leflunomide (L), methotrexate (M), sulfasalazine (S), and placebo (P). The y-axis shows score changes with progression downward, across trials of 12 or 6 months. Values for each treatment group are displayed as bars with numeric labels.*
FDA Label Image

Image (B9ae0559 441f 4be3 88e5 336b2bbfa2b2 06)

Image (B9ae0559 441f 4be3 88e5 336b2bbfa2b2 06)
A bar chart titled 'Change in Functional Ability Measure' showing improvement scores measured by HAQ Disability Index across three clinical trials. Trials compare Leflunomide (L), Methotrexate (M), Placebo (P), and Sulfasalazine (S) over 6 to 12 months. Bars represent negative and positive changes indicating improvement or decline in functional ability.*
FDA Label Image

Label (Lbl713352403)

Label (Lbl713352403)
Leflunomide Tablets USP 20 mg film-coated oral tablets packaging label. The label includes the NDC 71335-2403-1, indicates a quantity of 30 tablets, and shows that the product is repackaged by Bryant Ranch Prepack, Inc. and manufactured by Zydus Lifesciences Ltd. Storage instructions advise keeping the drug out of reach of children, storing at 20° to 25°C, and protecting from light.*

* About these descriptions: Image descriptions on this page are generated by automated AI analysis of the product label images from the manufacturer's FDA label submission (SPL). They are provided for reference only and may contain errors or omissions. Always rely on the printed label itself and the official FDA labeling, and consult a pharmacist or healthcare professional with any questions about this product.