Desvenlafaxine Tablet, Extended Release
Product Images NDC 71335-2490

View Photos of Packaging, Regulatory Labels, and Product Appearance

Product Visual Gallery

This gallery contains 7 technical images submitted to the FDA as part of the official labeling for Desvenlafaxine (NDC 71335-2490). Unlike standard consumer photos, these assets often include clinical data figures, molecular chemical structures, and official manufacturer packaging layouts.

As provided by Bryant Ranch Prepack, these visuals offer a comprehensive scientific overview of the product's physical and chemical identity, aiding pharmacists and researchers in product verification and study.

FDA Label Image

Image Description (Desvenlafaxine Tablets Figure 1)
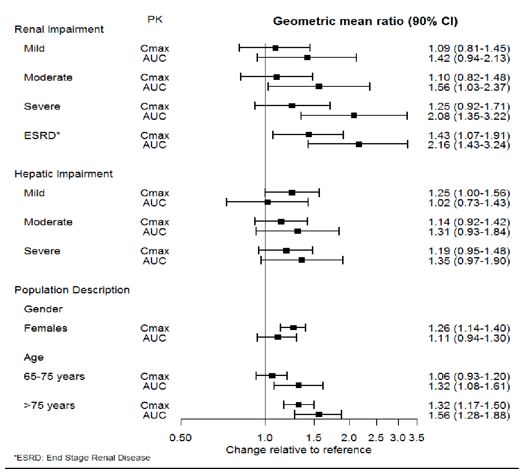
Image Description (Desvenlafaxine Tablets Figure 1)
A chart showing geometric mean ratios with 90% confidence intervals for Cmax and AUC pharmacokinetic parameters of desvenlafaxine under different conditions: renal impairment (mild, moderate, severe, ESRD), hepatic impairment (mild, moderate, severe), and population descriptions (gender: females; age groups: 65-75 years, >75 years). The x-axis represents change relative to reference, ranging from 0.50 to 3.5.*
FDA Label Image

Image Description (Desvenlafaxine Tablets Figure 2)

Image Description (Desvenlafaxine Tablets Figure 2)
A pharmacokinetic chart showing the geometric mean ratio and 90% confidence interval for Cmax and AUC of desvenlafaxine when coadministered with CYP3A4 inhibitor ketoconazole. The chart depicts changes relative to reference values on a scale from 0.5 to 2.0.*
FDA Label Image

Image Description (Desvenlafaxine Tablets Figure 3)

Image Description (Desvenlafaxine Tablets Figure 3)
A chart showing the geometric mean ratio (90% CI) of pharmacokinetic parameters (Cmax, AUC, AUCinf, AUClast) indicating changes in drug levels caused by Desvenlafaxine on various interacting drugs including Desipramine, Midazolam, Tamoxifen, and Aripiprazole at different dosages. The horizontal axis represents change relative to reference values.*
FDA Label Image

Image Description (Desvenlafaxine Tablets Figure 4)

Image Description (Desvenlafaxine Tablets Figure 4)
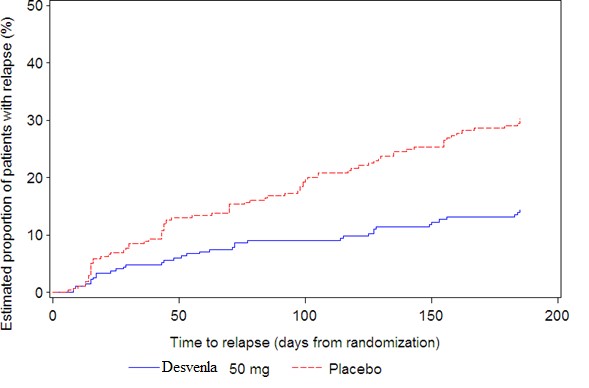
A Kaplan-Meier plot showing the estimated proportion of patients with relapse (%) over time (days from randomization) for Desvenlafaxine 50 mg versus placebo. The graph has two lines: a solid blue line for Desvenlafaxine 50 mg and a dashed red line for placebo, illustrating relapse rates over approximately 200 days.*
FDA Label Image

Image Description (Desvenlafaxine Tablets Figure 5)

Image Description (Desvenlafaxine Tablets Figure 5)
A Kaplan-Meier curve depicting the estimated proportion of patients experiencing relapse over time (in days) since randomization. The graph compares two groups: patients taking desvenlafaxine (solid blue line) and those taking placebo (dashed red line), showing a lower proportion and slower increase in relapse among the desvenlafaxine group.*
FDA Label Image

Image Description (Desvenlafaxine Tablets Structure)

Image Description (Desvenlafaxine Tablets Structure)
Chemical structure diagram of desvenlafaxine with associated molecular groups, including a phenol, tertiary amine, cyclohexane, carboxylic acid groups, and a water molecule (hydrate).*
FDA Label Image

Label (Lbl713352490)

Label (Lbl713352490)
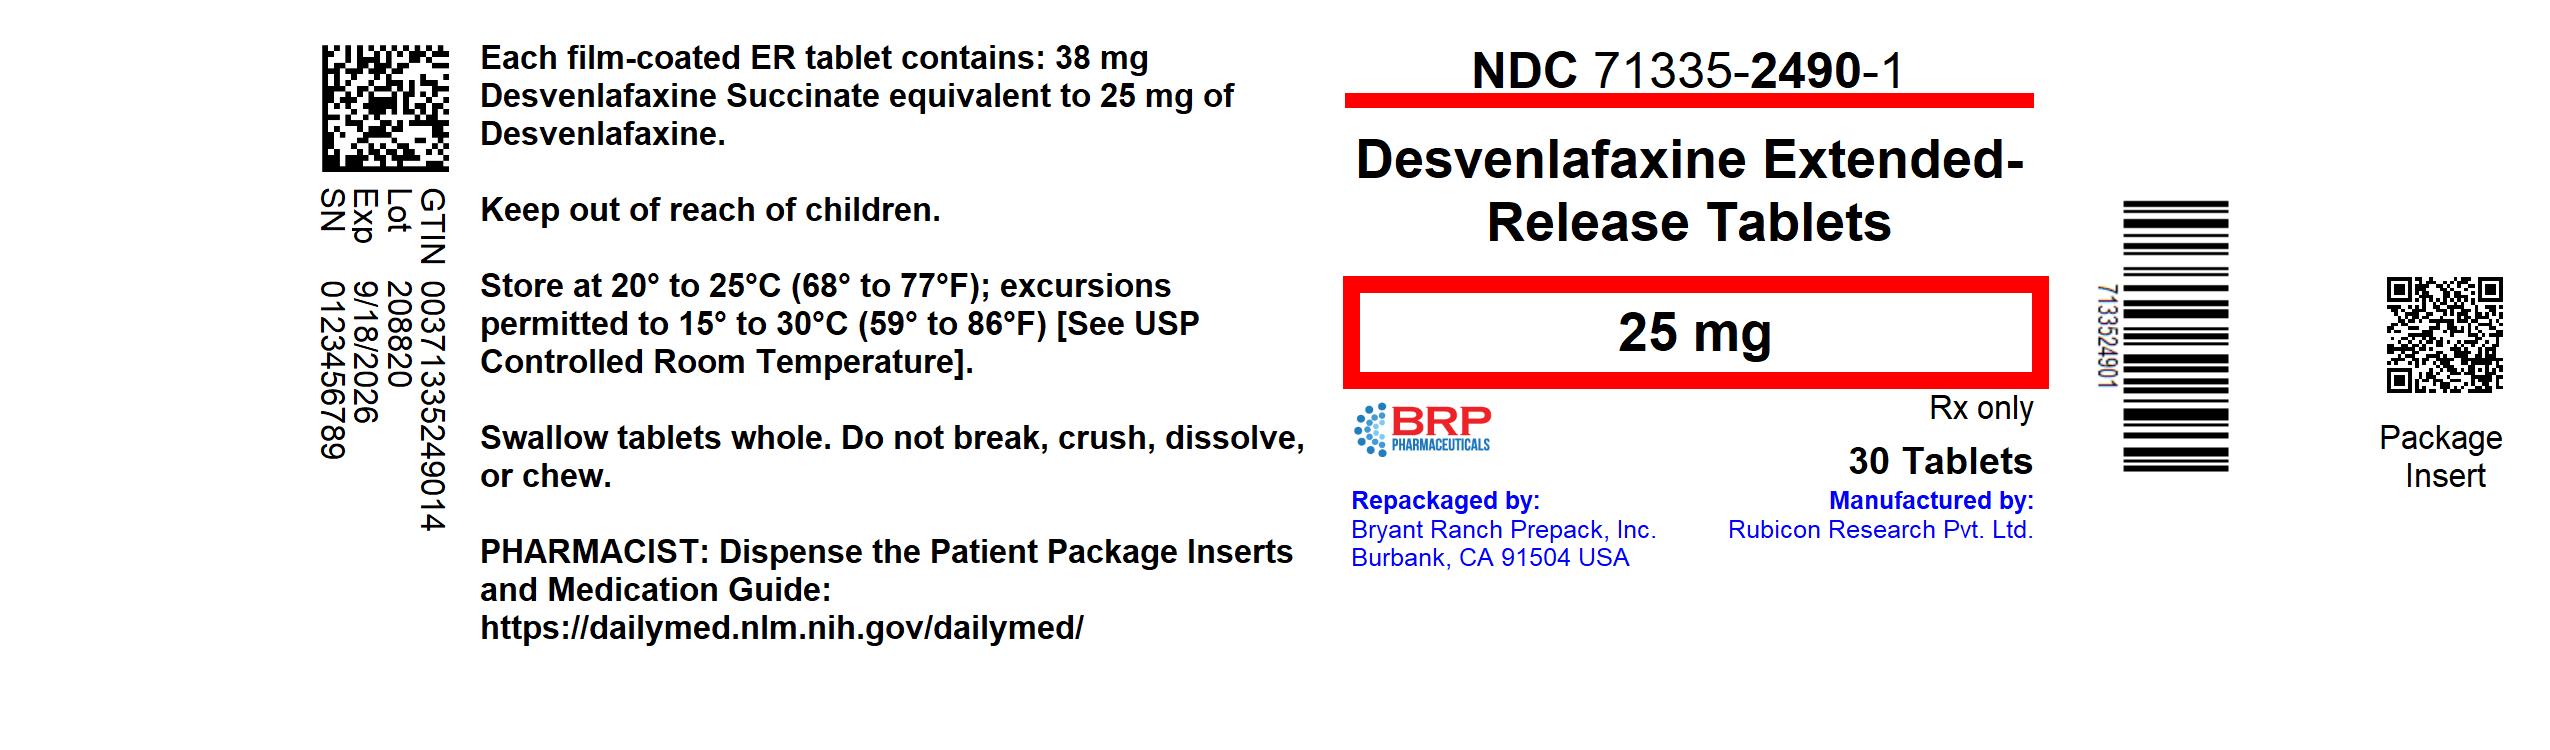
Label for Desvenlafaxine Extended-Release Tablets 25 mg from Bryant Ranch Prepack. The label indicates the package contains 30 tablets and provides storage instructions. It includes manufacturer information (Rubicon Research Pvt. Ltd.) and a statement to keep the tablets whole, not to break or chew. The NDC is 71335-2490-1.*

* About these descriptions: Image descriptions on this page are generated by automated AI analysis of the product label images from the manufacturer's FDA label submission (SPL). They are provided for reference only and may contain errors or omissions. Always rely on the printed label itself and the official FDA labeling, and consult a pharmacist or healthcare professional with any questions about this product.