Desvenlafaxine Tablet, Extended Release
Product Images NDC 71335-2575

View Photos of Packaging, Regulatory Labels, and Product Appearance

Product Visual Gallery

This gallery contains 7 technical images submitted to the FDA as part of the official labeling for Desvenlafaxine (NDC 71335-2575). Unlike standard consumer photos, these assets often include clinical data figures, molecular chemical structures, and official manufacturer packaging layouts.

As provided by Bryant Ranch Prepack, these visuals offer a comprehensive scientific overview of the product's physical and chemical identity, aiding pharmacists and researchers in product verification and study.

FDA Label Image

Image Description (Desvenlafaxine Tablets Figure 1)

Image Description (Desvenlafaxine Tablets Figure 1)
A forest plot chart illustrating the geometric mean ratio with 90% confidence intervals for Cmax and AUC of desvenlafaxine under different conditions. The chart compares pharmacokinetic parameters by renal impairment severity, hepatic impairment severity, and population subgroups including females and age groups 65-75 years and over 75 years, indicating changes relative to reference values.*
FDA Label Image

Image Description (Desvenlafaxine Tablets Figure 2)

Image Description (Desvenlafaxine Tablets Figure 2)
A plot showing the geometric mean ratio with 90% confidence intervals for pharmacokinetic parameters Cmax and AUC in the presence of CYP3A4 inhibitors, specifically ketoconazole. The x-axis represents the change relative to reference, ranging from 0.50 to 2.0. Cmax has a value near 1.08, and AUC near 1.43, each with corresponding confidence interval bars.*
FDA Label Image

Image Description (Desvenlafaxine Tablets Figure 3)

Image Description (Desvenlafaxine Tablets Figure 3)
A pharmacokinetic chart showing the geometric mean ratio (90% confidence interval) of Cmax and AUC changes due to Desvenlafaxine interaction with various drugs including Desipramine, Midazolam, Tamoxifen, and Aripiprazole at different doses. The x-axis represents change relative to reference on a scale ranging from 0.5 to 2.5.*
FDA Label Image

Image Description (Desvenlafaxine Tablets Figure 4)

Image Description (Desvenlafaxine Tablets Figure 4)
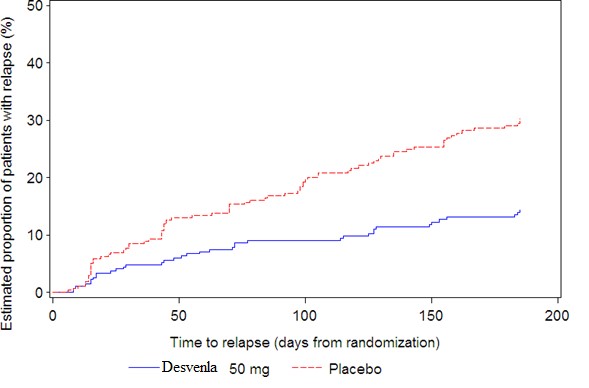
A Kaplan-Meier survival curve graph showing time to relapse in days from randomization on the x-axis and the estimated proportion of patients with relapse percentage on the y-axis. The graph compares two groups: Desvenlafaxine 50 mg (blue solid line) and placebo (red dashed line), indicating differences in relapse rates over approximately 190 days.*
FDA Label Image

Image Description (Desvenlafaxine Tablets Figure 5)

Image Description (Desvenlafaxine Tablets Figure 5)
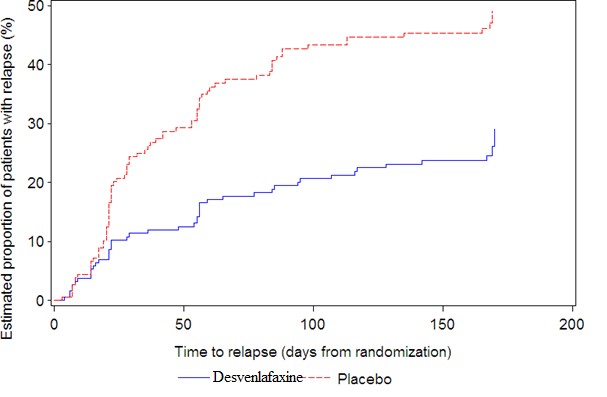
A line graph depicting estimated proportion of patients with relapse (%) on the vertical axis against time to relapse (days from randomization) on the horizontal axis, comparing Desvenlafaxine (solid blue line) and Placebo (dashed red line) groups over approximately 180 days.*
FDA Label Image

Image Description (Desvenlafaxine Tablets Structure)

Image Description (Desvenlafaxine Tablets Structure)
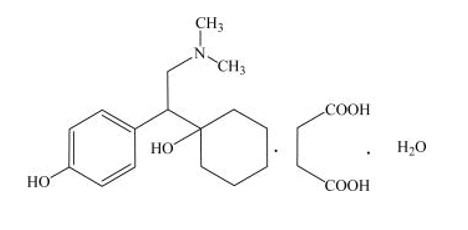
Chemical structure of desvenlafaxine showing its molecular components, including aromatic ring, hydroxyl groups, and associated molecular groups with water (H2O).*
FDA Label Image

Label (Lbl713352575)

Label (Lbl713352575)
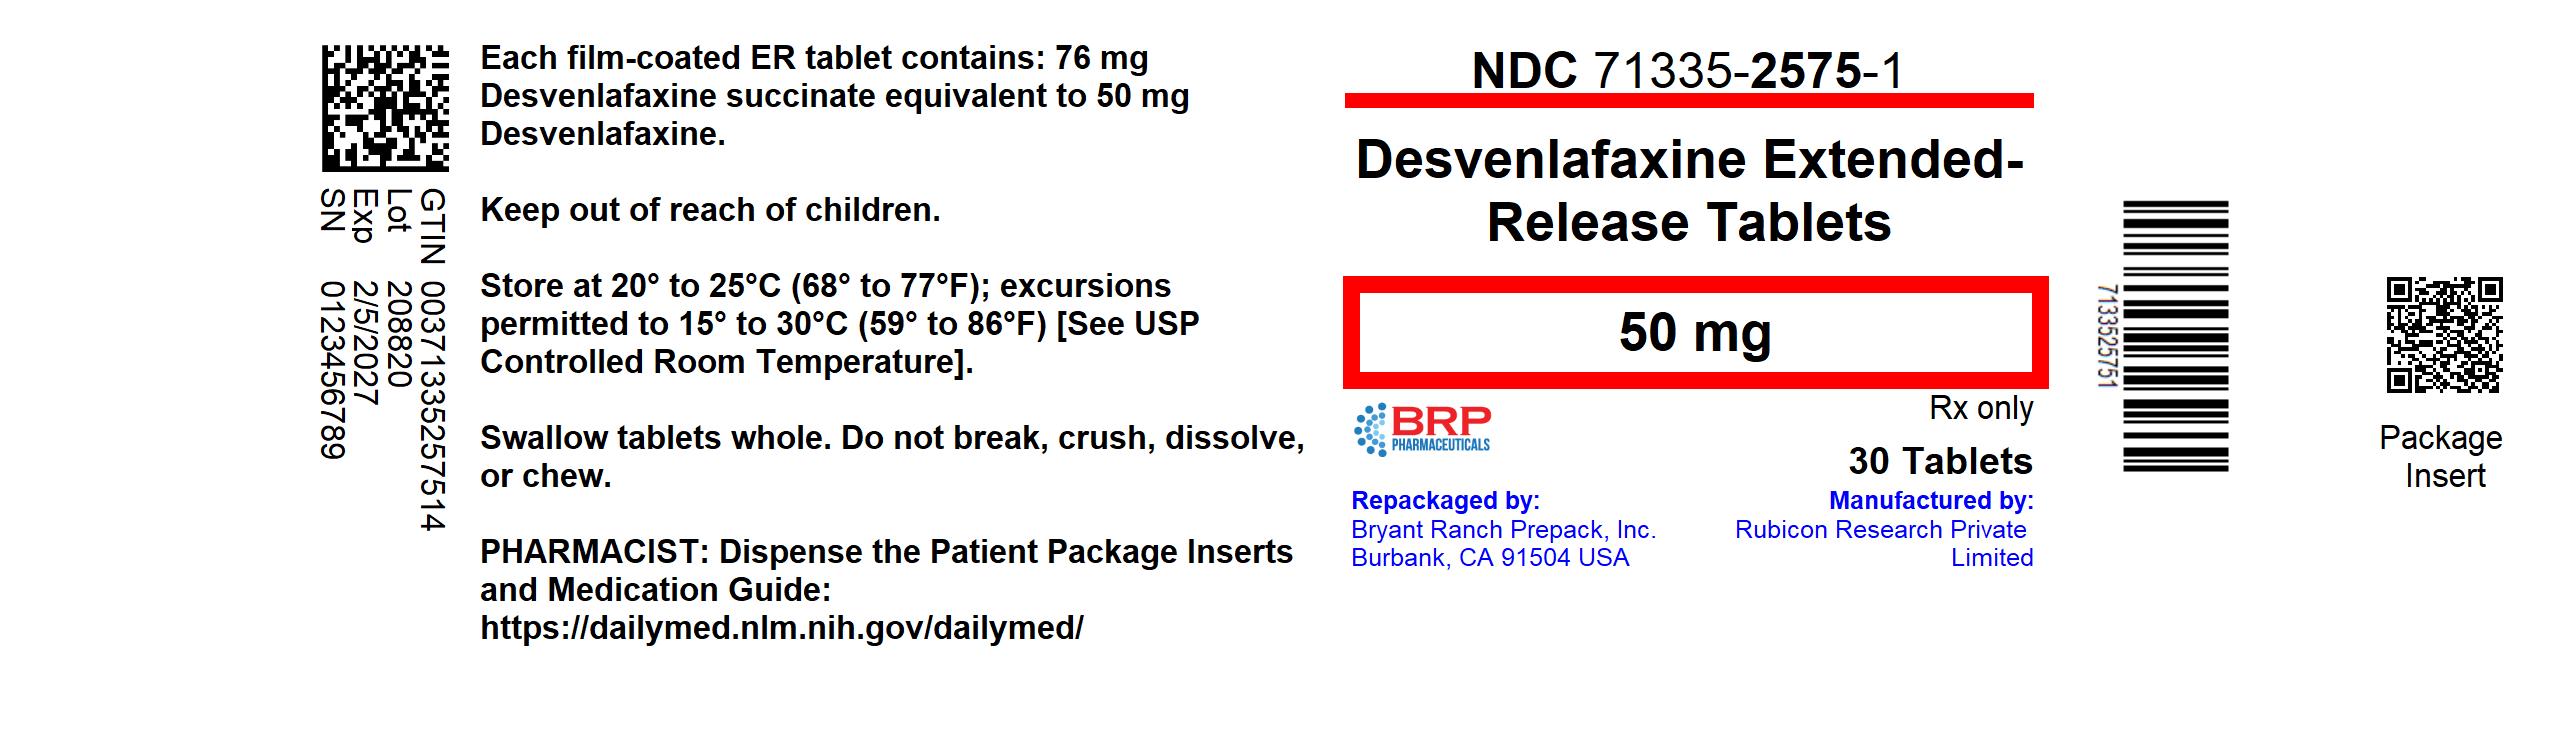
Label for Desvenlafaxine Extended-Release Tablets 50 mg by Bryant Ranch Prepack. The label shows the NDC number 71335-2575-1 and indicates that the package contains 30 tablets. It includes storage instructions, a barcode, QR codes, and identifies Rubicon Research Private Limited as the manufacturer.*

* About these descriptions: Image descriptions on this page are generated by automated AI analysis of the product label images from the manufacturer's FDA label submission (SPL). They are provided for reference only and may contain errors or omissions. Always rely on the printed label itself and the official FDA labeling, and consult a pharmacist or healthcare professional with any questions about this product.