Irbesartan Tablet
Product Images NDC 71335-2745

View Photos of Packaging, Regulatory Labels, and Product Appearance

Product Visual Gallery

This gallery contains 5 technical images submitted to the FDA as part of the official labeling for Irbesartan (NDC 71335-2745). Unlike standard consumer photos, these assets often include clinical data figures, molecular chemical structures, and official manufacturer packaging layouts.

As provided by Bryant Ranch Prepack, these visuals offer a comprehensive scientific overview of the product's physical and chemical identity, aiding pharmacists and researchers in product verification and study.

FDA Label Image

Label (Lbl713352745)
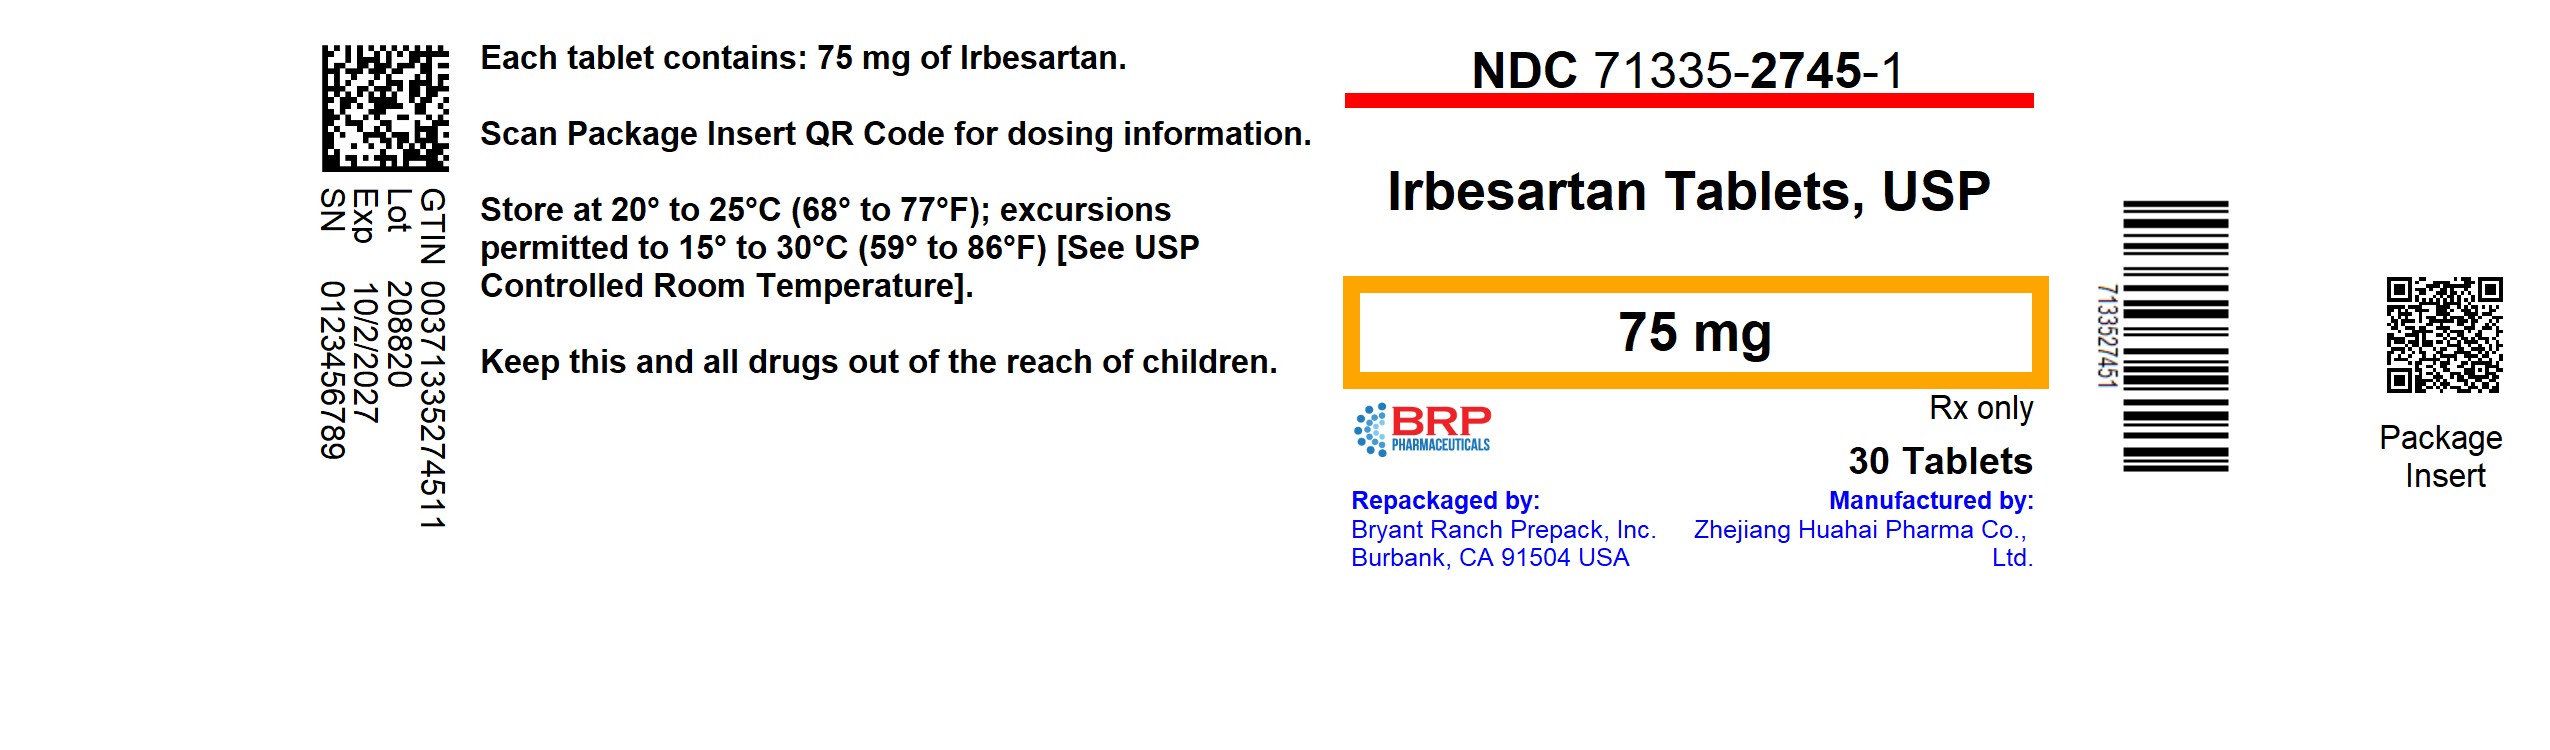
Label (Lbl713352745)
Label for Irbesartan Tablets USP, 75 mg oral tablets, in a 30 count package. The label includes NDC 71335-2745-1 and states packaging by Bryant Ranch Prepack with manufacturing by Zhejiang Huahai Pharma Co., Ltd. Storage instructions and a QR code for dosing information are also visible.*
FDA Label Image

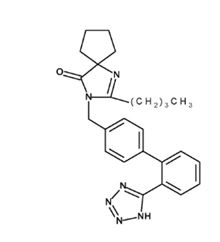
Structure (Spl Image1 Structure)

Structure (Spl Image1 Structure)
Chemical structure of Irbesartan, a human prescription drug with a 75 mg oral tablet formulation by Bryant Ranch Prepack. The structure illustrates the molecular arrangement of atoms in the active ingredient Irbesartan.*
FDA Label Image

Figure 1 (Spl Image2 Figure1)

Figure 1 (Spl Image2 Figure1)
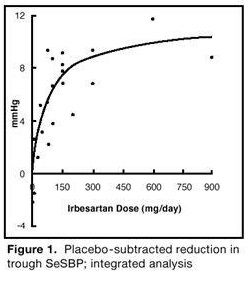
A scatter plot chart showing the relationship between Irbesartan dose (mg/day) on the x-axis and placebo-subtracted reduction in trough SeSBP (mmHg) on the y-axis. Data points indicate variation, with a curve demonstrating the dose-response trend from 0 to about 900 mg/day.*
FDA Label Image

Figure 2 (Spl Image3 Figure2)

Figure 2 (Spl Image3 Figure2)
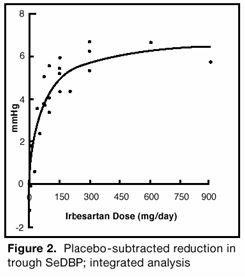
A scatter plot with a fitted curve showing the placebo-subtracted reduction in trough SeDBP on the y-axis (measured in mmHg) versus Irbesartan dose in mg per day on the x-axis. The data points and smooth curve illustrate the dose-response relationship for Irbesartan from an integrated analysis.*
FDA Label Image

Figure 3 (Spl Image4 Figure3)

Figure 3 (Spl Image4 Figure3)
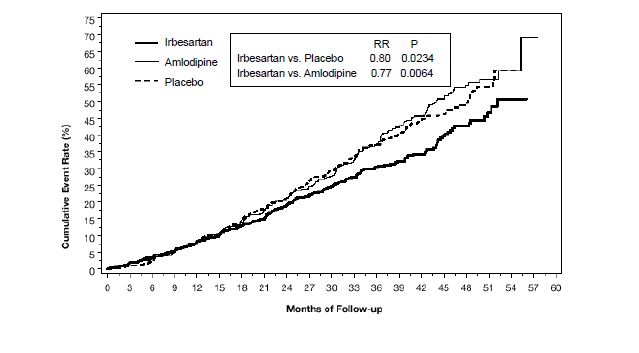
A cumulative event rate line graph comparing Irbesartan, Amlodipine, and Placebo over a follow-up period of up to 57 months. The y-axis shows the cumulative event rate percentage, and the x-axis represents months of follow-up. The graph includes a legend with relative risk (RR) and p-values comparing Irbesartan to Placebo and Amlodipine.*

* About these descriptions: Image descriptions on this page are generated by automated AI analysis of the product label images from the manufacturer's FDA label submission (SPL). They are provided for reference only and may contain errors or omissions. Always rely on the printed label itself and the official FDA labeling, and consult a pharmacist or healthcare professional with any questions about this product.