Cinacalcet Tablet
Product Images NDC 71335-2761

View Photos of Packaging, Regulatory Labels, and Product Appearance

Product Visual Gallery

This gallery contains 6 technical images submitted to the FDA as part of the official labeling for Cinacalcet (NDC 71335-2761). Unlike standard consumer photos, these assets often include clinical data figures, molecular chemical structures, and official manufacturer packaging layouts.

As provided by Bryant Ranch Prepack, these visuals offer a comprehensive scientific overview of the product's physical and chemical identity, aiding pharmacists and researchers in product verification and study.

FDA Label Image

Image (00722e4a 7103 49ef 8cfd 6a14b0088f0e 01)
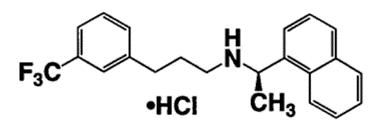
Image (00722e4a 7103 49ef 8cfd 6a14b0088f0e 01)
Chemical structure of cinacalcet hydrochloride, showing the molecular arrangement including a trifluoromethyl group, aromatic rings, and a hydrochloride moiety represented by ·HCl.*
FDA Label Image

Image (00722e4a 7103 49ef 8cfd 6a14b0088f0e 02)

Image (00722e4a 7103 49ef 8cfd 6a14b0088f0e 02)
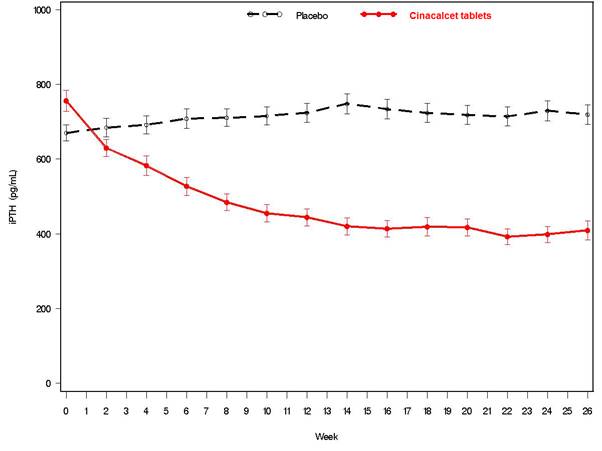
A line graph showing parathyroid hormone (PTH) levels in pg/mL over a 26-week period comparing placebo and Cinacalcet tablets. The X-axis represents weeks (0 to 26) and the Y-axis displays PTH levels from 0 to 1000 pg/mL. Cinacalcet tablets show a marked decrease in PTH levels over time, while placebo maintains higher PTH levels with slight fluctuations.*
FDA Label Image

Image (00722e4a 7103 49ef 8cfd 6a14b0088f0e 03)

Image (00722e4a 7103 49ef 8cfd 6a14b0088f0e 03)
A line graph comparing calcium-phosphorus product levels (Ca x P mg/dL) over 26 weeks between subjects taking placebo and those taking Cinacalcet tablets. The x-axis represents weeks from 0 to 26, and the y-axis shows Ca x P levels ranging approximately from 0 to 70 mg/dL. Cinacalcet tablets data are represented by a red line showing a decline and lower stabilized levels compared to placebo, which is shown as a black dashed line remaining relatively steady.*
FDA Label Image

Image (00722e4a 7103 49ef 8cfd 6a14b0088f0e 04)

Image (00722e4a 7103 49ef 8cfd 6a14b0088f0e 04)
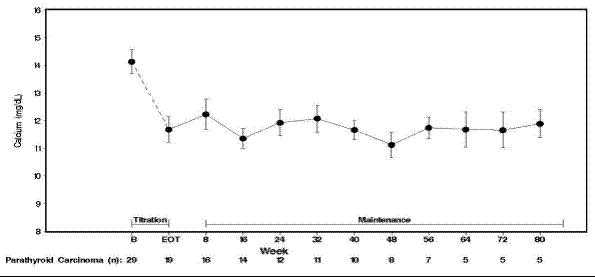
A line graph showing mean calcium levels (mg/dL) over time in weeks in patients with parathyroid carcinoma. The x-axis represents weeks from baseline to week 80, with key points labeled B, EOT, and Maintenance phases. The y-axis shows calcium levels ranging from 8 to 16 mg/dL. Data include error bars indicating variability at each time point.*
FDA Label Image

Image (00722e4a 7103 49ef 8cfd 6a14b0088f0e 05)

Image (00722e4a 7103 49ef 8cfd 6a14b0088f0e 05)
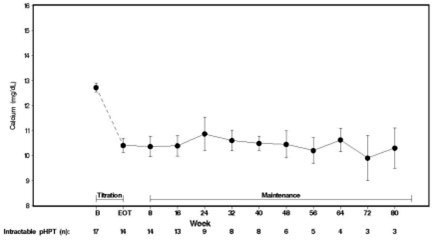
A line graph showing calcium levels (mg/dL) over weeks of treatment, including titration and maintenance phases, with error bars for variability. The x-axis represents time in weeks, while the y-axis shows calcium concentration. Additional data points for intractable pHPT percentages are listed below the timeline.*
FDA Label Image

Label (Lbl713352761)

Label (Lbl713352761)
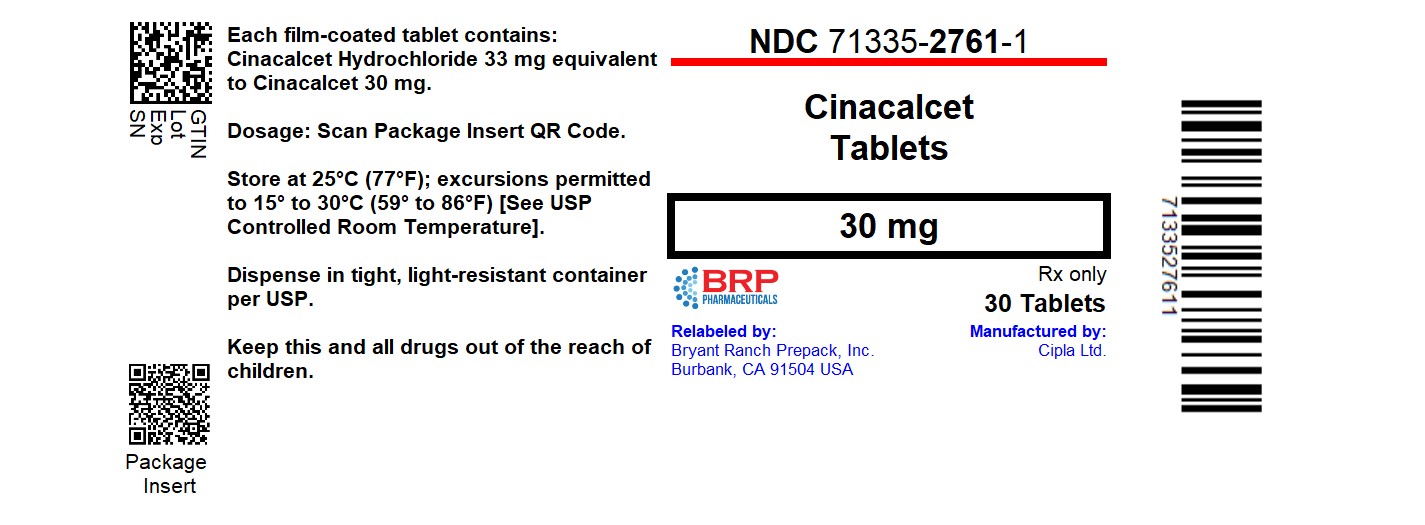
Label for Cinacalcet Tablets, 30 mg, oral dosage form. The label includes NDC 71335-2761-1, packaging for 30 tablets, and indicates the product is relabeled by Bryant Ranch Prepack and manufactured by Cipla Ltd. Storage and dispensing instructions are provided along with QR codes for dosage and package insert information.*

* About these descriptions: Image descriptions on this page are generated by automated AI analysis of the product label images from the manufacturer's FDA label submission (SPL). They are provided for reference only and may contain errors or omissions. Always rely on the printed label itself and the official FDA labeling, and consult a pharmacist or healthcare professional with any questions about this product.