Duloxetine Capsule, Delayed Release
Product Images NDC 71335-3062

View Photos of Packaging, Regulatory Labels, and Product Appearance

Product Visual Gallery

This gallery contains 12 technical images submitted to the FDA as part of the official labeling for Duloxetine (NDC 71335-3062). Unlike standard consumer photos, these assets often include clinical data figures, molecular chemical structures, and official manufacturer packaging layouts.

As provided by Bryant Ranch Prepack, these visuals offer a comprehensive scientific overview of the product's physical and chemical identity, aiding pharmacists and researchers in product verification and study.

FDA Label Image

Figure1 (Duloxetine Fig1)
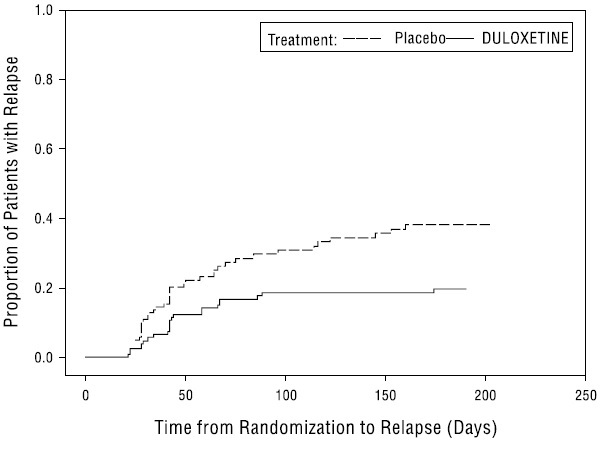
Figure1 (Duloxetine Fig1)
A Kaplan-Meier survival curve graph depicting the proportion of patients with relapse over time from randomization in days. Two treatment groups are compared: Duloxetine and placebo. The y-axis represents the proportion of patients with relapse, ranging from 0.0 to 1.0, while the x-axis shows time from randomization up to 250 days. The Duloxetine group shows a lower proportion of relapse compared to the placebo group across the observed period.*
FDA Label Image

Figure10 (Duloxetine Fig10)

Figure10 (Duloxetine Fig10)
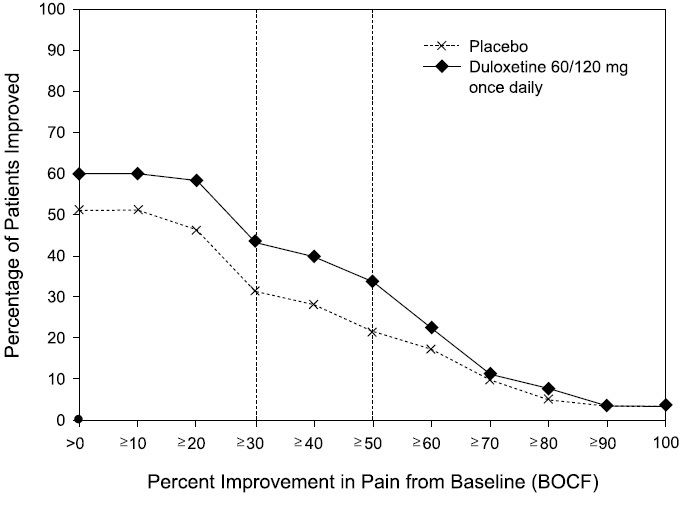
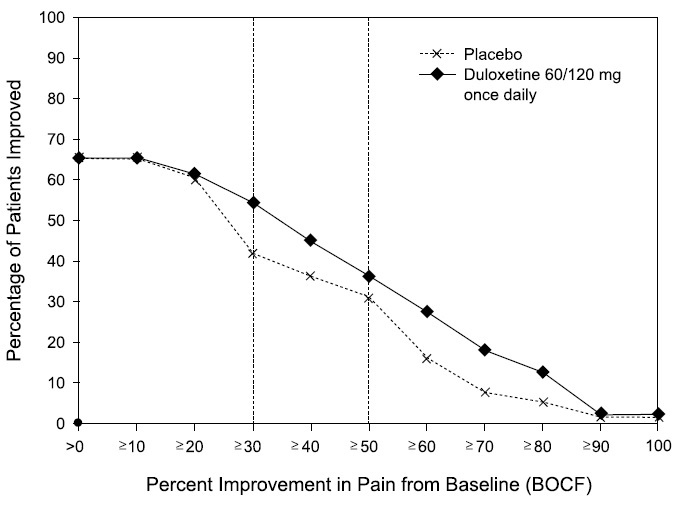
A line graph comparing the percentage of patients improved versus percent improvement in pain from baseline (BOCF) between placebo and Duloxetine 60/120 mg once daily. The graph shows two lines, one for placebo and one for Duloxetine, illustrating patient improvement rates across increasing pain improvement percentages.*
FDA Label Image

Figure2 (Duloxetine Fig2)

Figure2 (Duloxetine Fig2)
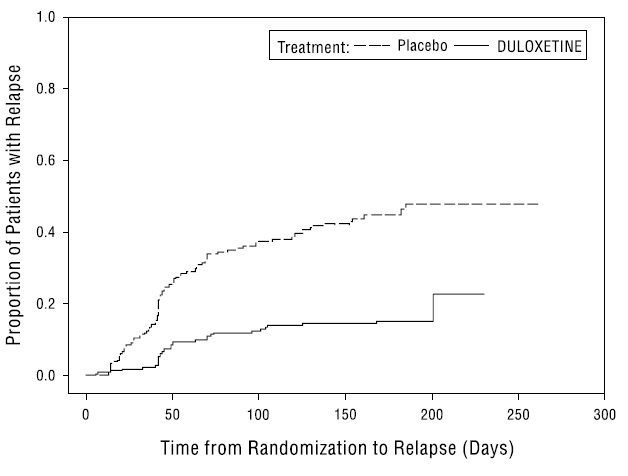
A line graph depicting the proportion of patients with relapse over time in days from randomization. Two treatment groups are shown: placebo with a dashed line and duloxetine with a solid line. The graph shows the increase in relapse proportion over approximately 250 days, with the placebo group having a higher relapse rate than the duloxetine group.*
FDA Label Image

Figure3 (Duloxetine Fig3)

Figure3 (Duloxetine Fig3)
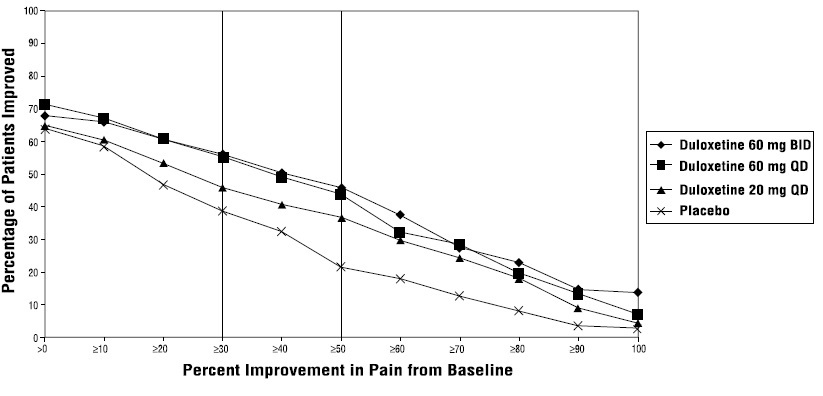
A line graph showing the percentage of patients improved versus percent improvement in pain from baseline. The graph compares four groups: Duloxetine 60 mg BID, Duloxetine 60 mg QD, Duloxetine 20 mg QD, and Placebo, illustrating trends of patient improvement across increasing pain relief percentages.*
FDA Label Image

Figure4 (Duloxetine Fig4)

Figure4 (Duloxetine Fig4)
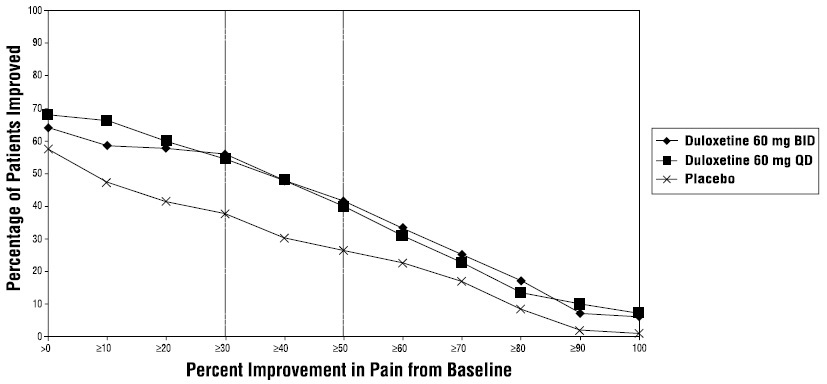
A line graph showing the percentage of patients improved versus percent improvement in pain from baseline. It compares three groups: Duloxetine 60 mg BID, Duloxetine 60 mg QD, and placebo, with higher improvement percentages observed in the Duloxetine groups compared to placebo across the pain improvement scale.*
FDA Label Image

Figure5 (Duloxetine Fig5)

Figure5 (Duloxetine Fig5)
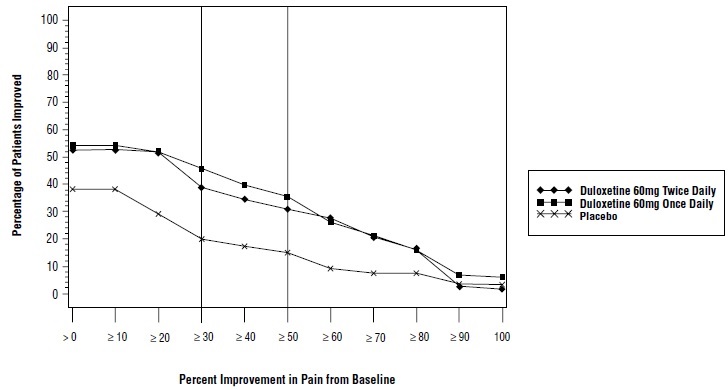
A line graph showing the percentage of patients improved versus percent improvement in pain from baseline, comparing Duloxetine 60 mg twice daily, Duloxetine 60 mg once daily, and placebo. The graph indicates trends for patient improvement across various pain improvement thresholds.*
FDA Label Image

Figure6 (Duloxetine Fig6)

Figure6 (Duloxetine Fig6)
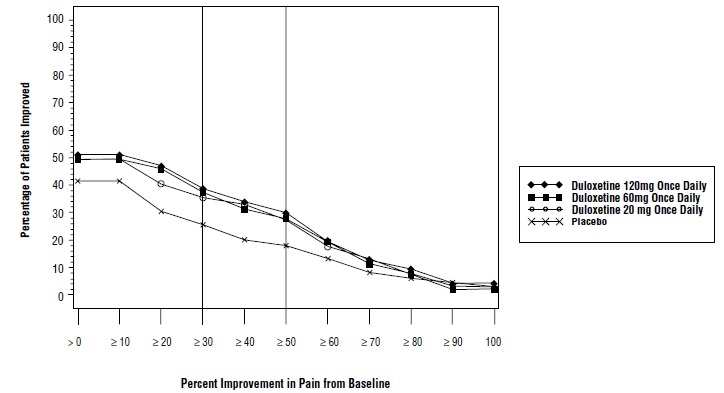
A line graph showing the percentage of patients improved versus percent improvement in pain from baseline. It compares Duloxetine at 20 mg, 60 mg, and 120 mg once daily doses against a placebo. The x-axis represents percent improvement in pain, and the y-axis represents the percentage of patients improved. The Duloxetine lines show higher patient improvement rates compared to placebo across pain improvement percentages.*
FDA Label Image

Figure7 (Duloxetine Fig7)

Figure7 (Duloxetine Fig7)
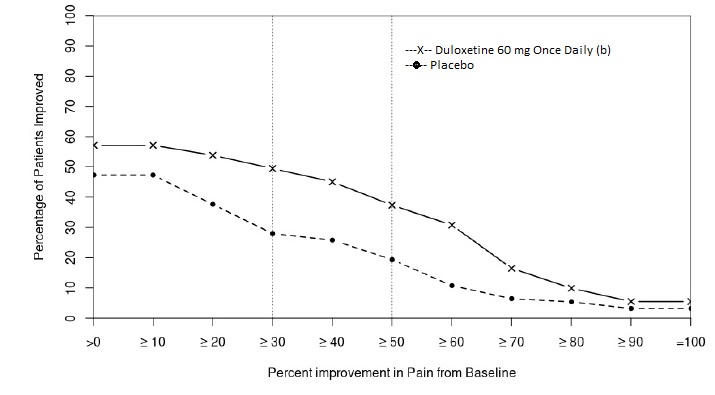
A line graph comparing percent improvement in pain from baseline between Duloxetine 60 mg once daily and placebo. The x-axis shows percent improvement in pain, while the y-axis shows the percentage of patients improved. Duloxetine consistently shows a higher percentage of patients improved across various pain improvement levels compared to placebo.*
FDA Label Image

Figure8 (Duloxetine Fig8)

Figure8 (Duloxetine Fig8)
A line graph comparing the percentage of patients improved versus percent improvement in pain from baseline (BOCF) for Duloxetine 60/120 mg once daily and placebo. The x-axis shows percent improvement in pain from 0 to 100%, and the y-axis shows the percentage of patients improved from 0 to 100%. Duloxetine and placebo are represented by solid and dashed lines respectively, with data points marked along the curves.*
FDA Label Image

Figure9 (Duloxetine Fig9)

Figure9 (Duloxetine Fig9)
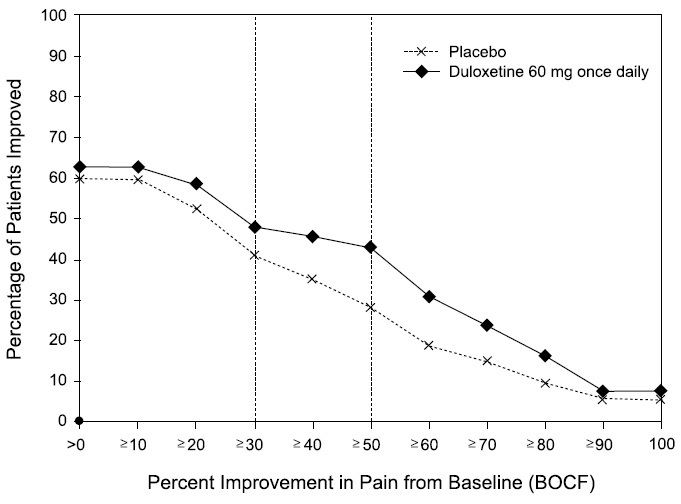
A line graph comparing the percentage of patients improved versus percent improvement in pain from baseline (BOCF) for Duloxetine 60 mg once daily and placebo. The graph shows two lines: one for Duloxetine with diamond markers and one for placebo with cross markers, indicating patient improvement trends over increasing pain improvement percentages.*
FDA Label Image

Structure (Duloxetine Structure)

Structure (Duloxetine Structure)
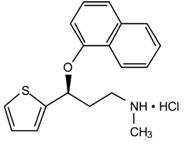
Chemical structure of duloxetine hydrochloride. The diagram shows the molecular framework including a thiophene ring, a chiral center, naphthalene moiety, and methylamino group with hydrochloride salt.*
FDA Label Image

Label (Lbl713353062)

Label (Lbl713353062)
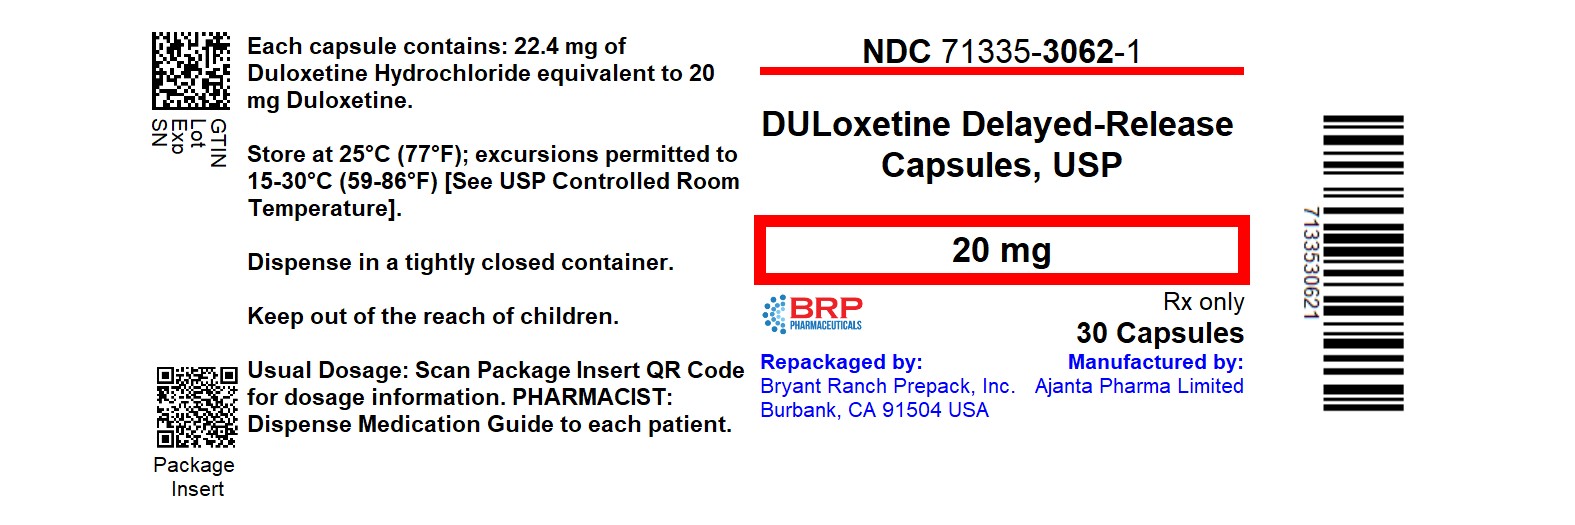
Label for Duloxetine delayed-release capsules, USP, 20 mg strength. The label indicates each capsule contains 22.4 mg of Duloxetine Hydrochloride equivalent to 20 mg Duloxetine. Package quantity is 30 capsules. Distributed by Bryant Ranch Prepack, manufactured by Ajanta Pharma Limited. Includes storage instructions at 25°C with permitted excursions and a barcode.*

* About these descriptions: Image descriptions on this page are generated by automated AI analysis of the product label images from the manufacturer's FDA label submission (SPL). They are provided for reference only and may contain errors or omissions. Always rely on the printed label itself and the official FDA labeling, and consult a pharmacist or healthcare professional with any questions about this product.