Pregabalin Capsule
Product Images NDC 71335-3118

View Photos of Packaging, Regulatory Labels, and Product Appearance

Product Visual Gallery

This gallery contains 15 technical images submitted to the FDA as part of the official labeling for Pregabalin (NDC 71335-3118). Unlike standard consumer photos, these assets often include clinical data figures, molecular chemical structures, and official manufacturer packaging layouts.

As provided by Bryant Ranch Prepack, these visuals offer a comprehensive scientific overview of the product's physical and chemical identity, aiding pharmacists and researchers in product verification and study.

FDA Label Image

Label (Lbl713353118)

Label (Lbl713353118)
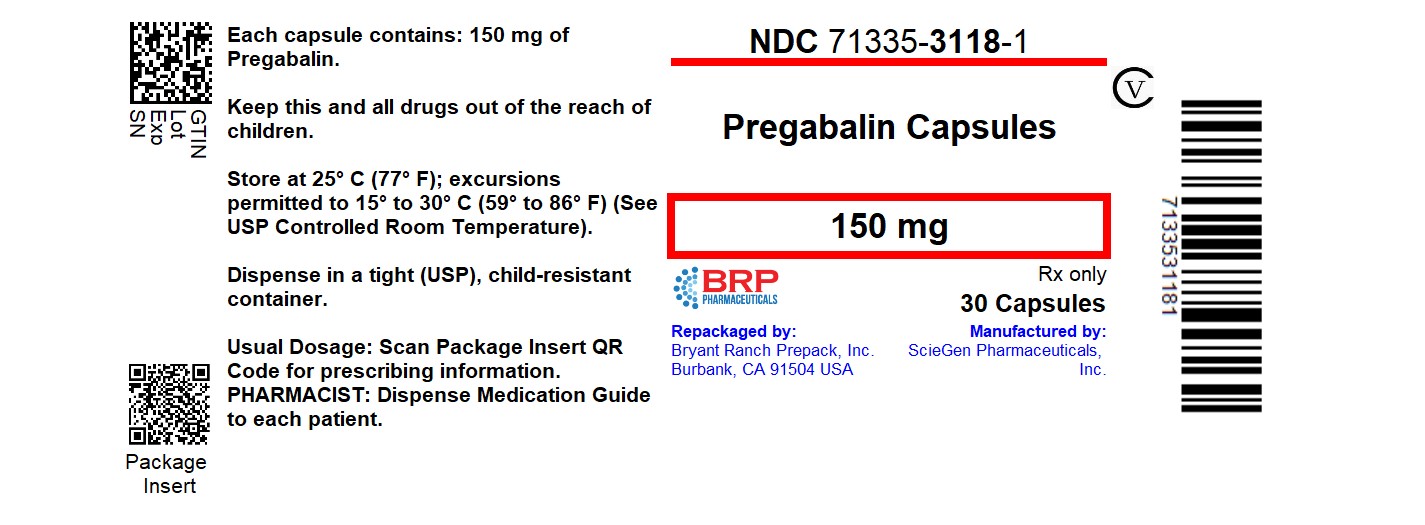
Each capsule of FH contains 150 mg of Pregabalin. It is important to store the capsules at a controlled room temperature not exceeding 30°C and keep them out of reach of children. Dispensing should be done in a tight, child-resistant container. The usual dosage information can be found in the package insert.*
FDA Label Image

Figure 1 (Pregabalin Fig01)

FDA Label Image

Figure 2 (Pregabalin Fig02)

Figure 2 (Pregabalin Fig02)
This is a table showing the percentage of patients who experienced pain improvement after taking Pregabalin at a dose of 160 mg for three days. The data suggests varying levels of improvement among patients, with percentages ranging from 2% to 100%. It also includes a chart with different values over a span of weeks.*
FDA Label Image

Figure 3 (Pregabalin Fig03)

Figure 3 (Pregabalin Fig03)
This text provides information on the percentage of patients improved for different medications and dosages. It includes details about Pregatalin and Pregabain dosages and frequency as well as a graph showing percentage improvement in pain from baseline.*
FDA Label Image

Figure 4 (Pregabalin Fig04)

Figure 4 (Pregabalin Fig04)
Parent of Patients Improved The text mentions the improved pain relief experienced by patients using three different treatment options: Pregabalin 200 mg three times a day, Pregabalin 100 mg three times a day, and Placebo. It also includes numerical data related to the pain improvement observed at various time points.*
FDA Label Image

Figure 5 (Pregabalin Fig05)

Figure 5 (Pregabalin Fig05)
This text appears to show a comparison between the effectiveness of Fregabalin 100 mg taken three times per day, Pregabalin 80 mg taken three times a day, and Placebo in improving pain in patients. The table indicates the number of patients who improved under each treatment, as well as the percentage improvement in pain from baseline.*
FDA Label Image

Figure 6 (Pregabalin Fig06)

Figure 6 (Pregabalin Fig06)
This is a description of a study evaluating the effect of different doses of a medication compared to a placebo. The study involves doses ranging from 50mg/day to 600mg/day of the medication and examines the statistically significant differences compared to the placebo group. The text does not provide detailed results or specific information on the medication being studied.*
FDA Label Image

Figure 7 (Pregabalin Fig07)

FDA Label Image

Figure 9 (Pregabalin Fig08)

Figure 9 (Pregabalin Fig08)
This text appears to be showing a comparison of the percentage of patients improved with different doses of pregabalin (300mg and 450mg) compared to a placebo. It also shows the percentage improvement in pain from baseline across different points. The data seems to be presented in a graph or chart format.*
FDA Label Image

Figure 10 (Pregabalin Fig09)

FDA Label Image

Figure 11 (Pregabalin Fig10)

FDA Label Image

Figure 12 (Pregabalin Fig11)

Figure 12 (Pregabalin Fig11)
This text provides information on the percentage of subjects who improved after a specified period. It also compares the improvement between Pregabalin and Placebo groups from the baseline to Week 16. The data includes numerical values representing the percent improvement for each group.*
FDA Label Image

Figure 13 (Pregabalin Fig13)

Figure 13 (Pregabalin Fig13)
This data seems to show different responder rates for various treatments or doses. The responder rate is given in percentages such as 40.6%, 29.1%, and 22.6%. Additionally, there is a reference to a placebo treatment at doses of 2.5 mg/kg/day and 10 mg/kg/day. The information may be related to a study or trial investigating the effectiveness of different treatments or doses on responders.*
FDA Label Image

Cockcroft And Gault Equation (Pregabalin Formula)

Cockcroft And Gault Equation (Pregabalin Formula)
Calculation of CLCT using the formula: [140 - age (years)] x weight (kg) for male patients and [140 - age (years)] x weight (kg) x 0.85 for female patients. Additionally, multiplying 72 by serum creatinine (mg/dL) is part of the formula for determining CLCT.*
FDA Label Image

Chemical Structure (Pregabalin Str)

* These product label images have been analyzed using experimental machine learning. Please verify findings with the primary label text.