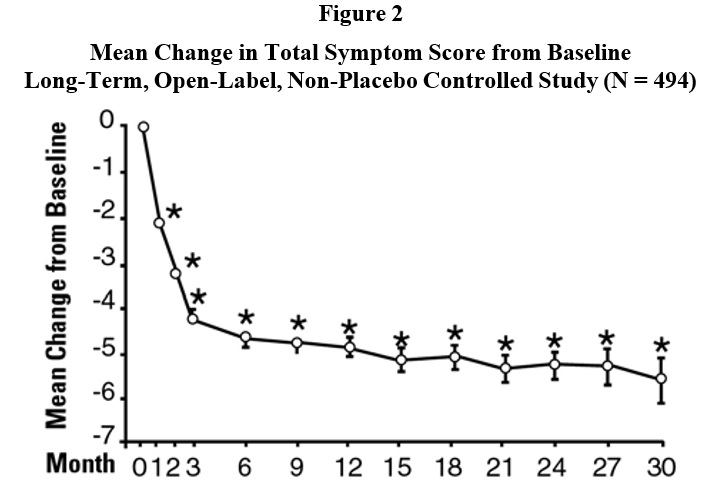
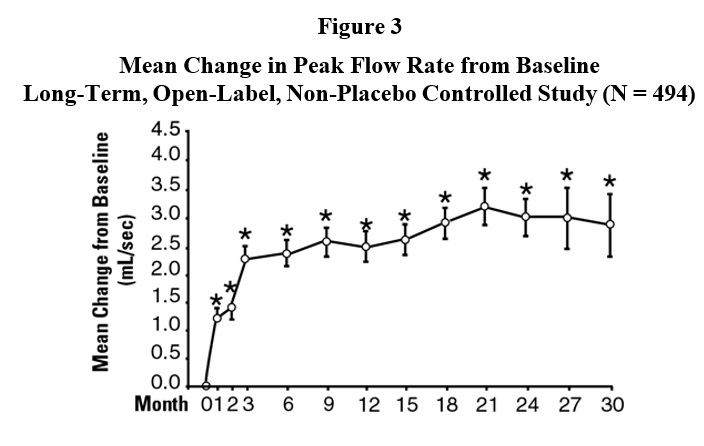
Image Description (Figure 01)
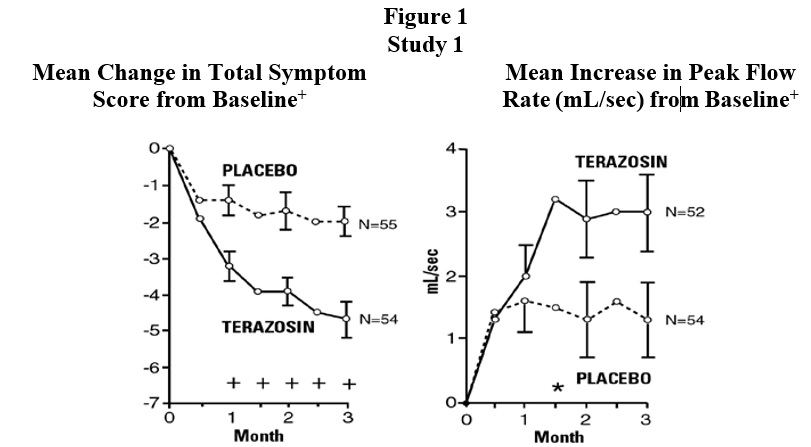
This text provides information related to the mean change in total symptom score from baseline for two different treatments - placebo and terazosin. It also outlines the mean increase in peak flow rate in mL/sec from baseline for terazosin and placebo over a span of three months. The data appears to be part of a study or clinical trial.*