Onpattro Injection, Lipid Complex
Product Images NDC 71336-1000

View Photos of Packaging, Regulatory Labels, and Product Appearance

Product Visual Gallery

This gallery contains 6 technical images submitted to the FDA as part of the official labeling for Onpattro (NDC 71336-1000). Unlike standard consumer photos, these assets often include clinical data figures, molecular chemical structures, and official manufacturer packaging layouts.

As provided by Alnylam Pharmaceuticals, Inc., these visuals offer a comprehensive scientific overview of the product's physical and chemical identity, aiding pharmacists and researchers in product verification and study.

FDA Label Image

Chemical Structure (Onpattro 01)
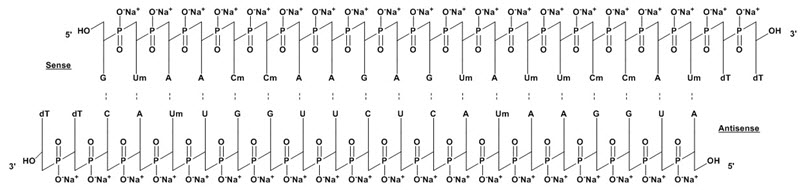
Chemical Structure (Onpattro 01)
Chemical structure diagram depicting the double-stranded RNA molecule of patisiran, showing the sense and antisense strands with nucleotide sequences and phosphate backbone, including sodium ions associated with the phosphate groups.*
FDA Label Image

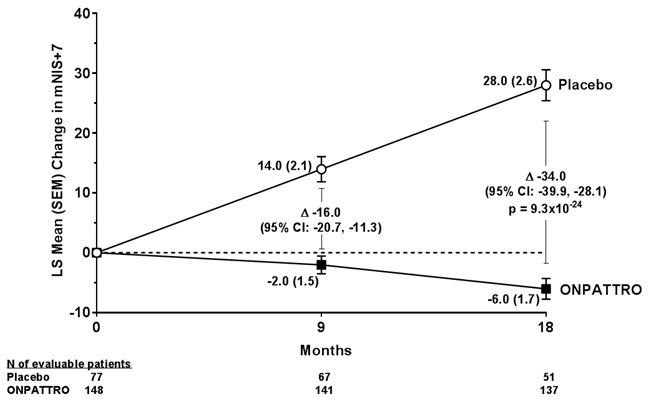
Figure 1 (Onpattro 02)

Figure 1 (Onpattro 02)
Line graph showing the least squares mean change in mNIS+7 scores over 18 months comparing Onpattro (patisiran) injection to placebo. The graph displays two lines: placebo with an increasing trend and Onpattro with a slight decreasing trend. Patient counts for each group are indicated at baseline, 9 months, and 18 months.*
FDA Label Image

Figure 2 (Onpattro 03)

Figure 2 (Onpattro 03)
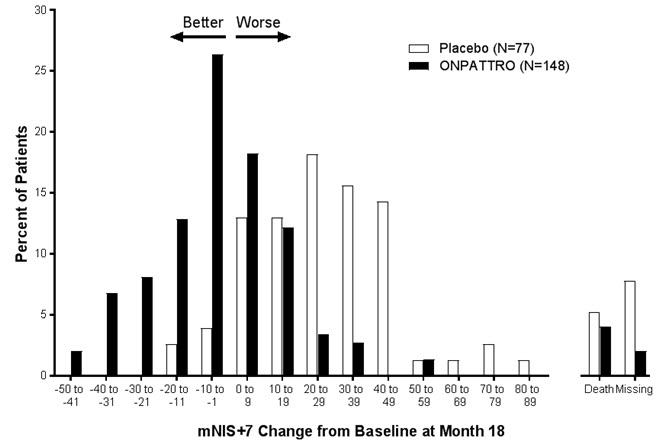
A bar chart comparing the percentage of patients experiencing changes from baseline mNIS+7 scores at month 18 between those treated with ONPATTRO and placebo groups. The x-axis shows the range of mNIS+7 changes from -50 to 89 and death/missing, with arrows indicating 'Better' to the left and 'Worse' to the right. The y-axis represents the percent of patients. ONPATTRO shows a higher percentage of patients with better outcomes (negative change values) compared to placebo, while placebo shows more patients with worse outcomes (positive change values).*
FDA Label Image

Figure 3 (Onpattro 04)

Figure 3 (Onpattro 04)
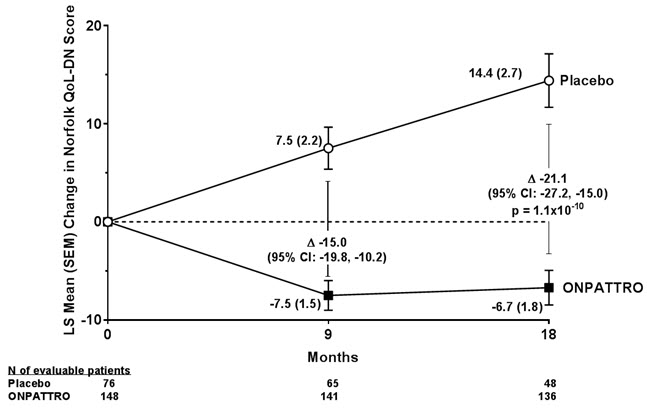
A line graph showing the least squares mean change in Norfolk QoL-DN score over 18 months for two groups: Placebo and ONPATTRO (patisiran). The y-axis represents change in score, ranging from -10 to 20, and the x-axis represents months (0, 9, 18). Placebo group scores increase positively over time, while ONPATTRO group scores decrease or remain near baseline, with error bars indicating standard error. Patient numbers at various time points are listed for each group.*
FDA Label Image

Figure 4 (Onpattro 05)

Figure 4 (Onpattro 05)
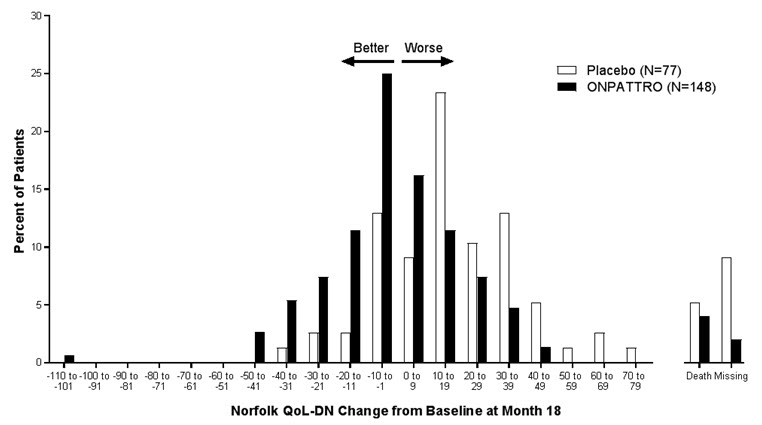
A histogram chart showing the distribution of percent of patients by Norfolk Quality of Life-Diabetic Neuropathy (QoL-DN) change from baseline at month 18. Two groups are compared: Placebo (N=77) represented by white bars, and ONPATTRO (patisiran) (N=148) represented by black bars. The x-axis measures change from -110 to 79, with a central region labeled as better (left) and worse (right). Additional bars represent death or missing data.*
FDA Label Image

Principal Display Panel (2 mg/mL Vial Carton)

Principal Display Panel (2 mg/mL Vial Carton)
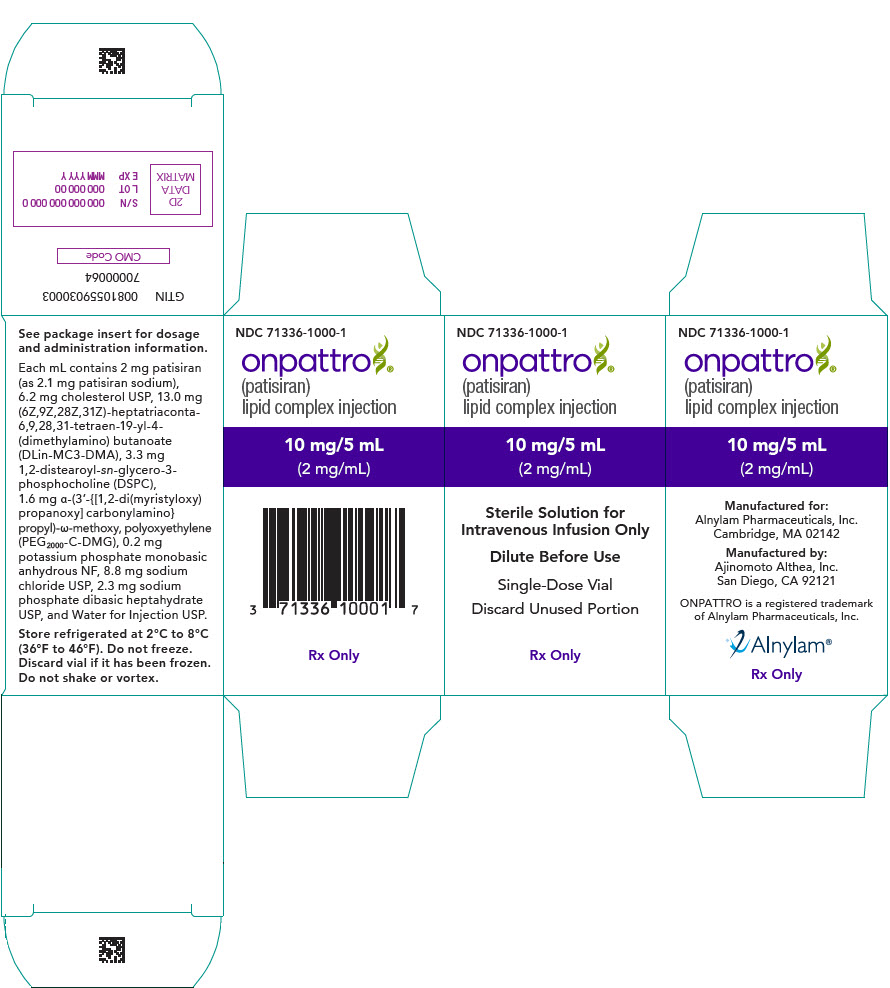
Packaging label for Onpattro (patisiran) lipid complex injection, 10 mg/5 mL (2 mg/mL) strength. The label indicates it is a sterile solution for intravenous use, single-dose vial, requiring dilution before use and disposal of unused portion. Manufactured by Ajinomoto Althea, Inc. for Alnylam Pharmaceuticals, Inc. The label includes storage instructions, active ingredient content, barcode, and multiple Rx Only markings.*

* About these descriptions: Image descriptions on this page are generated by automated AI analysis of the product label images from the manufacturer's FDA label submission (SPL). They are provided for reference only and may contain errors or omissions. Always rely on the printed label itself and the official FDA labeling, and consult a pharmacist or healthcare professional with any questions about this product.