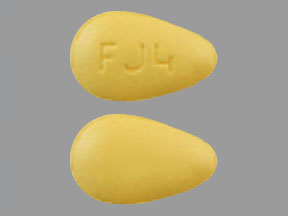
20mg Tadalafil (20mg Tadalafil Label)

This is a package of 10 tablets containing 20 mg of Tadalafil USP meant for oral ingestion. The package insert contains the dosage information which should be strictly followed by the patient. The tablets are to be kept in a tight container at room temperature of 20°-25°C (68°-77°F). The medicine is manufactured by ACCORD HEALTHCARE and packaged by Q% @mem ENTERPRISES, located in Cumming GA, 3004. It is recommended to keep the medication away from children.*