Tramadol Hydrochloride Tablet, Film Coated
Product Images NDC 71610-006

5 FDA label images from Aphena Pharma Solutions - Tennessee, Llc · Packaging, Regulatory Labels, and Product Appearance

Product Visual Gallery

This gallery contains 5 technical images submitted to the FDA as part of the official labeling for Tramadol Hydrochloride (NDC 71610-006). Unlike standard consumer photos, these assets often include clinical data figures, molecular chemical structures, and official manufacturer packaging layouts.

As provided by Aphena Pharma Solutions - Tennessee, Llc, these visuals offer a comprehensive scientific overview of the product's physical and chemical identity, aiding pharmacists and researchers in product verification and study.

FDA Label Image

71610 0006 15

71610 0006 15
Label for Tramadol Hydrochloride 50 mg tablets, film-coated, in a 15-tablet package. Manufacturer is TEVA Czech Industries s.r.o., with packaging by Aphena Pharma Solutions - Tennessee, LLC. The label includes storage instructions, dispensing information, and RX only designation with a warning about habit formation. The product is an oral prescription drug.*

FDA Label Image

Aphena Pharma Solutions (TN)

FDA Label Image

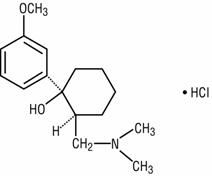
Chemical Structure-tramadol Hydrochloride (Image 01)

Chemical Structure-tramadol Hydrochloride (Image 01)
Chemical structure of Tramadol Hydrochloride showing its molecular framework including aromatic, cyclohexane, and hydroxyl groups, alongside the hydrochloride component.*
FDA Label Image

Figure 1 (Image 02)

Figure 1 (Image 02)
A pharmacokinetic concentration-time graph showing plasma concentrations (ng/mL) of Tramadol and its metabolite M1 after single and multiple doses over 48 hours. The x-axis is time in hours (0 to 48), and the y-axis is concentration on a logarithmic scale (1 to 1000 ng/mL). Curves for Tramadol and M1 are differentiated by line style and dose type.*
FDA Label Image

Figure 2 (Image 03)

Figure 2 (Image 03)
A line graph titled 'Time to Discontinuation Due to Nausea/Vomiting' showing the percentage of subjects discontinuing treatment over 25 days in double-blind study conditions. The single plotted line represents discontinuation during a 10-day period to 200 mg/day dose. The graph's y-axis indicates percent discontinuing up to 50%, and the x-axis shows days from 0 to 25.*

* About these descriptions: Image descriptions on this page are generated by automated AI analysis of the product label images from the manufacturer's FDA label submission (SPL). They are provided for reference only and may contain errors or omissions. Always rely on the printed label itself and the official FDA labeling, and consult a pharmacist or healthcare professional with any questions about this product.