Lyrica
Product Images NDC 71610-071

View Photos of Packaging, Regulatory Labels, and Product Appearance

Product Visual Gallery

This gallery contains 18 technical images submitted to the FDA as part of the official labeling for Lyrica (NDC 71610-071). Unlike standard consumer photos, these assets often include clinical data figures, molecular chemical structures, and official manufacturer packaging layouts.

As provided by Aphena Pharma Solutions - Tennessee, Llc, these visuals offer a comprehensive scientific overview of the product's physical and chemical identity, aiding pharmacists and researchers in product verification and study.

FDA Label Image

Bottle Label 25 mg (71610 0071 30)

Bottle Label 25 mg (71610 0071 30)
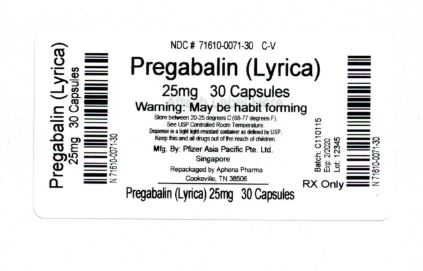
This is a prescription medication called Pregabalin, commonly sold under the brand name Lyrica. The pack contains 30 capsules of 25mg strength. The medication has a warning regarding the possibility of it being habit-forming. The rest of the text is not readable.*
FDA Label Image

Aphena Pharma Solutions (TN)

FDA Label Image

Cockcroft And Gault Equation (Lyrica 01)

Cockcroft And Gault Equation (Lyrica 01)
This appears to be a medical formula for calculating the estimated glomerular filtration rate (eGFR) of a patient. The formula takes into account the patient's weight, serum creatinine levels, and gender (by adjusting the value of Cl for female patients). However, there is a small error in the text, as the character "fi" is not recognized, and should be replaced with "fi".*
FDA Label Image

Chemical Structure (Lyrica 02)

FDA Label Image

Figure 1 (Lyrica 03)

Figure 1 (Lyrica 03)
Percent of Patients Improved data is available but the rest of the text is not-readable.*
FDA Label Image

Figure 2 (Lyrica 04)

FDA Label Image

Figure 3 (Lyrica 05)

FDA Label Image

Figure 4 (Lyrica 06)

FDA Label Image

Figure 5 (Lyrica 07)

Figure 5 (Lyrica 07)
This appears to be a statistical report on the percentage of patients who showed improvement in pain from baseline after taking Pregabalin and Progabalin at various doses during the day. However, the information is incomplete and not presented in a clear manner, making it difficult to accurately interpret.*
FDA Label Image

Figure 6 (Lyrica 08)

FDA Label Image

Figure 7 (Lyrica 09)

FDA Label Image

Figure 8 (Lyrica 10)

Figure 8 (Lyrica 10)
The text seems to show a table displaying the responder rates in percentages. The first two columns appear to be empty, while the third column presents percentages ranging from 40.6% to 226%. The table includes a row indicating the treatment used, with two options being "Placebo 2.5 mg/kglday" and "10 mgrkgiday". It also shows values of 93% and 103% for each treatment, respectively.*
FDA Label Image

Figure 9 (Lyrica 11)

Figure 9 (Lyrica 11)
This text is not available as it contains incomplete sentences, symbols and unintelligible characters.*
FDA Label Image

Figure 10 (Lyrica 12)

FDA Label Image

Figure 11 (Lyrica 13)

Figure 11 (Lyrica 13)
This is a table that represents the percentage of subjects who improved between baseline and week 12 on Pregabalin medication. The percentages range from 50 to 100, with the majority being between 90 and 100.*
FDA Label Image

Figure 12 (Lyrica 14)

FDA Label Image

Logo (Lyrica 14a)

Logo (Lyrica 14a)
This text is a statement indicating the distributor of a product, Parke-Davis, which is a division of Pfizer Inc, located in NY, NY.*
FDA Label Image

Logo (Lyrica 14b)

Logo (Lyrica 14b)
This is a description of a pharmaceutical product indicating that it is distributed by Parke-Davis, a division of Pfizer Inc located in NY, NY 10017.*

* These product label images have been analyzed using experimental machine learning. Please verify findings with the primary label text.