Atorvastatin Calcium
Product Images NDC 71610-116

View Photos of Packaging, Regulatory Labels, and Product Appearance

Product Visual Gallery

This gallery contains 6 technical images submitted to the FDA as part of the official labeling for Atorvastatin Calcium (NDC 71610-116). Unlike standard consumer photos, these assets often include clinical data figures, molecular chemical structures, and official manufacturer packaging layouts.

As provided by Aphena Pharma Solutions - Tennessee, Llc, these visuals offer a comprehensive scientific overview of the product's physical and chemical identity, aiding pharmacists and researchers in product verification and study.

FDA Label Image

Bottle Label 20 mg (71610 0116 45)

Bottle Label 20 mg (71610 0116 45)
Atorvastatin Calcium 20 mg label for a bottle of 45 tablets. The label includes storage instructions, dispensing requirements, manufacturer information (Kremers Urban Pharmaceuticals Inc., Seymour, IN), and repackager details (Aphena Pharma, Cookeville, TN). The label also states RX only and displays the NDC 71610-0116-45.*

FDA Label Image

Aphena Pharma Solutions (TN)

FDA Label Image

Chemical Structure (Atorvastatin Calcium Tablets 1)

Chemical Structure (Atorvastatin Calcium Tablets 1)
Chemical structure of Atorvastatin Calcium showing the molecular arrangement including aromatic rings, hydroxyl groups, fluorine atom, and calcium ion complexation with hydrate water molecules.*
FDA Label Image

Figure 1 (Atorvastatin Calcium Tablets 2)

Figure 1 (Atorvastatin Calcium Tablets 2)
A line graph showing cumulative incidence percentages over a 3.5-year period comparing Atorvastatin and Placebo groups. The graph displays two lines, a solid line for Atorvastatin and a dashed line for Placebo, with cumulative incidence increasing for both but higher in the Placebo group. Statistical values HR=0.64 (0.50-0.83) and p=0.0005 are noted on the graph.*
FDA Label Image

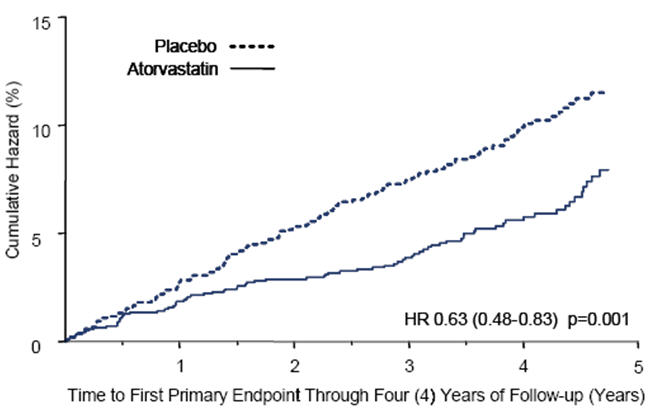
Figure 2 (Atorvastatin Calcium Tablets 3)

Figure 2 (Atorvastatin Calcium Tablets 3)
A cumulative hazard graph comparing Atorvastatin and placebo groups over a four-year follow-up period. The y-axis shows cumulative hazard percentage, and the x-axis represents time in years to first primary endpoint. The plot includes hazard ratio and p-value statistics (HR 0.63, p=0.001) indicating differences between groups.*
FDA Label Image

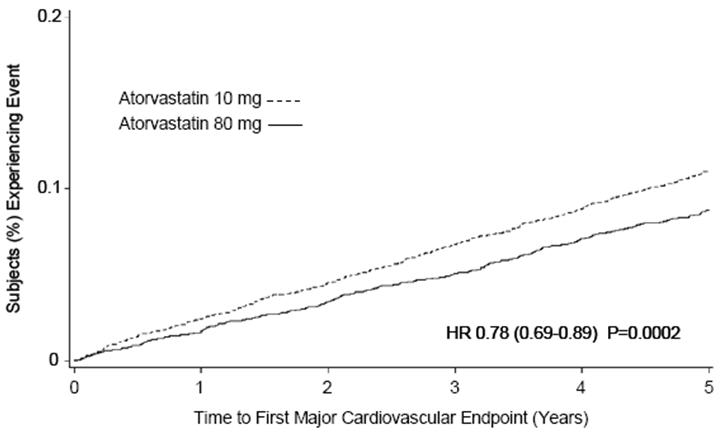
Figure 3 (Atorvastatin Calcium Tablets 4)

Figure 3 (Atorvastatin Calcium Tablets 4)
A line chart depicting the time to first major cardiovascular endpoint over five years for two Atorvastatin dosage groups, 10 mg and 80 mg. The y-axis shows the percentage of subjects experiencing the event, and the x-axis represents time in years. The graph compares event rates between the two doses with a hazard ratio (HR) of 0.78 and a p-value of 0.0002.*

* About these descriptions: Image descriptions on this page are generated by automated AI analysis of the product label images from the manufacturer's FDA label submission (SPL). They are provided for reference only and may contain errors or omissions. Always rely on the printed label itself and the official FDA labeling, and consult a pharmacist or healthcare professional with any questions about this product.