Duloxetine Capsule, Delayed Release
Product Images NDC 71610-402

View Photos of Packaging, Regulatory Labels, and Product Appearance

Product Visual Gallery

This gallery contains 11 technical images submitted to the FDA as part of the official labeling for Duloxetine (NDC 71610-402). Unlike standard consumer photos, these assets often include clinical data figures, molecular chemical structures, and official manufacturer packaging layouts.

As provided by Aphena Pharma Solutions - Tennessee, Llc, these visuals offer a comprehensive scientific overview of the product's physical and chemical identity, aiding pharmacists and researchers in product verification and study.

FDA Label Image

Bottle Label 20 mg (71610 0401 83)

Bottle Label 20 mg (71610 0401 83)
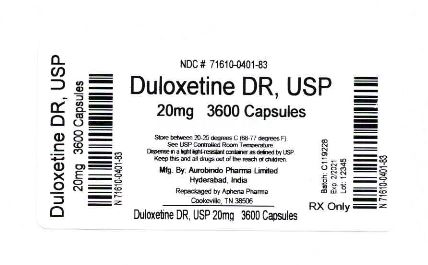
This is a product description for Duloxetine DR, USP, which is a medication available in 20mg dose and comes in a package of 3600 capsules. The NOC number is also provided.*
FDA Label Image

Bottle Label 30 mg (71610 0402 60)

FDA Label Image

Aphena Pharma Solutions (TN)

FDA Label Image

Figure 1: Kaplan-meier Estimation Of Cumulative Proportion Of Patients With Relapse (mdd Study 5) (Duloxetine Fig1)

Figure 1: Kaplan-meier Estimation Of Cumulative Proportion Of Patients With Relapse (mdd Study 5) (Duloxetine Fig1)
This is a figure showing the Kaplan-Meier estimation of the cumulative proportion of patients with relapse in a MDD Study 5. It includes a graph with time on the x-axis and the proportion of patients with relapse on the y-axis. The two treatments, placebo and duloxetine, are represented by two lines.*
FDA Label Image

Fig2 (Duloxetine Fig2)

FDA Label Image

Figure 3: Percentage Of Patients Achieving Various Levels Of Pain Relief As Measured By 24-hour Average Pain Severity (DPNP-1)

FDA Label Image

Figure 4: Percentage Of Patients Achieving Various Levels Of Pain Relief As Measured By 24-hour Average Pain Severity (DPNP-2)

FDA Label Image

Figure 7: Percentage Of Patients Achieving Various Levels Of Pain Relief As Measured By 24-hour Average Pain Severity – Clbp-1 (Duloxetine Fig5)

FDA Label Image

Figure 8: Percentage Of Patients Achieving Various Levels Of Pain Relief As Measured By 24-hour Average Pain Severity – Clbp-3 (Duloxetine Fig6)

FDA Label Image

Figure 9: Percentage Of Patients Achieving Various Levels Of Pain Relief As Measured By 24-hour Average Pain Severity – Oa-1 (Duloxetine Fig7)

Figure 9: Percentage Of Patients Achieving Various Levels Of Pain Relief As Measured By 24-hour Average Pain Severity – Oa-1 (Duloxetine Fig7)
This appears to be a graph or chart related to the effectiveness of a medication called Duloxetine in reducing pain levels versus a placebo. The graph shows the percentage of patients who achieved varying levels of pain relief based on a baseline measurement. Unfortunately, without more context or information it is difficult to provide a more detailed description or analysis.*
FDA Label Image

Structure (Duloxetine Str)

* These product label images have been analyzed using experimental machine learning. Please verify findings with the primary label text.