Tadalafil Tablet
Product Images NDC 71610-461

10 FDA label images from Aphena Pharma Solutions - Tennessee, Llc · Packaging, Regulatory Labels, and Product Appearance

Product Visual Gallery

This gallery contains 10 technical images submitted to the FDA as part of the official labeling for Tadalafil (NDC 71610-461). Unlike standard consumer photos, these assets often include clinical data figures, molecular chemical structures, and official manufacturer packaging layouts.

As provided by Aphena Pharma Solutions - Tennessee, Llc, these visuals offer a comprehensive scientific overview of the product's physical and chemical identity, aiding pharmacists and researchers in product verification and study.

FDA Label Image

Bottle Label 5 mg (71610 0461 08)

Bottle Label 5 mg (71610 0461 08)
Label for Tadalafil, USP 5 mg tablets, containing 8 tablets per package. The label displays the NDC number 71610-0461-08 and storage instructions to keep between 20-25 degrees Celsius. Manufactured by Ajanta Pharma USA Inc. in Bridgewater, NJ, and repackaged by Aphena Pharma Solutions - Tennessee, LLC in Cookeville, TN. The label includes a barcode, lot number, batch code, and expiration date 02/2021.*
FDA Label Image

Aphena Pharma Solutions (TN)

FDA Label Image

Figure1 (Tadalafil Figure1)

Figure1 (Tadalafil Figure1)
A set of four line graphs depicting the differences in blood pressure measurements (in mmHg) over time (hours) comparing Tadalafil versus placebo. The graphs show standing systolic, standing diastolic, supine systolic, and supine diastolic blood pressure values over a 96-hour period, with measurements plotted at multiple time points.*
FDA Label Image

Figure2 (Tadalafil Figure2)

Figure2 (Tadalafil Figure2)
A set of two line graphs showing the effect of Tadalafil 20 mg with doxazosin 8 mg versus placebo with doxazosin 8 mg on standing and supine systolic blood pressure over 24 hours post-dose. The y-axis measures changes in systolic blood pressure (mmHg), and the x-axis shows time in hours.*
FDA Label Image

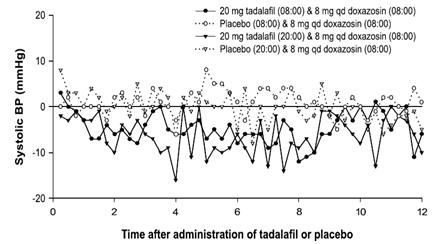
Figure3 (Tadalafil Figure3)

Figure3 (Tadalafil Figure3)
A line graph depicting the effect on systolic blood pressure (mmHg) over time after administration of tadalafil or placebo, combined with doxazosin. The x-axis shows time in hours post-administration up to 12 hours, and the y-axis shows change in systolic blood pressure in mmHg, with lines representing different treatment groups including tadalafil at 8:00 and 20:00 dosages versus placebo, all alongside 8 mg daily doxazosin.*
FDA Label Image

Figure4 (Tadalafil Figure4)

Figure4 (Tadalafil Figure4)
A pharmacokinetic line graph showing plasma tadalafil concentration (µg/L) over time (hours). Three curves compare single 20-mg dose, single 5-mg dose, and once-daily 5-mg dose after 5 consecutive days of administration, with concentration decreasing over time.*
FDA Label Image

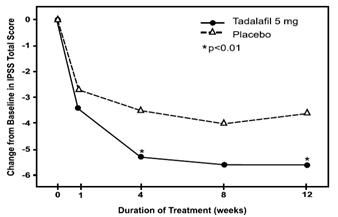
Figure5 (Tadalafil Figure5)

Figure5 (Tadalafil Figure5)
A line graph comparing the change from baseline in IPSS Total Score over 12 weeks of treatment between Tadalafil 5 mg and placebo groups. The x-axis represents the duration of treatment in weeks, and the y-axis shows the change from baseline with Tadalafil showing greater improvement.*
FDA Label Image

Figure6 (Tadalafil Figure6)

Figure6 (Tadalafil Figure6)
A line graph comparing the change from baseline in IPSS total score over 12 weeks of treatment between Tadalafil 5 mg and placebo groups. The x-axis represents duration of treatment in weeks, and the y-axis shows change from baseline, with Tadalafil showing a greater decrease in score than placebo over time.*
FDA Label Image

Figure7 (Tadalafil Figure7)

Figure7 (Tadalafil Figure7)
A line graph showing mean change from baseline over 26 weeks of therapy comparing Tadalafil/Finasteride and Placebo/Finasteride. The y-axis represents LS mean change, ranging from 1.0 to -7.0, and the x-axis represents time in weeks (0, 4, 12, 26). Data points with statistical significance annotations (p<0.001, p<0.05) are included.*
FDA Label Image

Structure (Tadalafil Structure)

Structure (Tadalafil Structure)
Chemical structure of tadalafil, showing its molecular framework with fused rings and functional groups as depicted in the image.*

* About these descriptions: Image descriptions on this page are generated by automated AI analysis of the product label images from the manufacturer's FDA label submission (SPL). They are provided for reference only and may contain errors or omissions. Always rely on the printed label itself and the official FDA labeling, and consult a pharmacist or healthcare professional with any questions about this product.