Quetiapine
Product Images NDC 71610-538

View Photos of Packaging, Regulatory Labels, and Product Appearance

Product Visual Gallery

This gallery contains 5 technical images submitted to the FDA as part of the official labeling for Quetiapine (NDC 71610-538). Unlike standard consumer photos, these assets often include clinical data figures, molecular chemical structures, and official manufacturer packaging layouts.

As provided by Aphena Pharma Solutions - Tennessee, Llc, these visuals offer a comprehensive scientific overview of the product's physical and chemical identity, aiding pharmacists and researchers in product verification and study.

FDA Label Image

Bottle Label 400 mg (71610 0538 87)
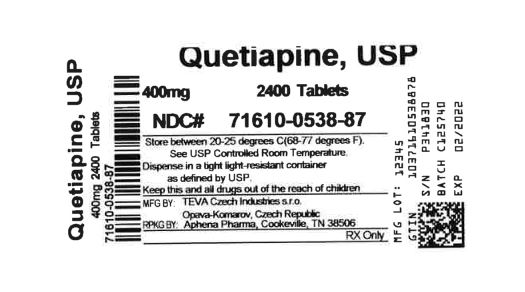
Bottle Label 400 mg (71610 0538 87)
Label for Quetiapine USP 400 mg tablets, containing 2400 tablets. The label indicates storage instructions to keep between 68-77 degrees Fahrenheit and to dispense in a tight light-resistant container. Manufactured by TEVA Czech Industries s.r.o. in the Czech Republic and repackaged by Aphena Pharma Solutions - Tennessee, LLC in Cookeville, TN. The product is marked RX Only and includes barcode, lot number, serial number, and expiration date details.*

FDA Label Image

Aphena Pharma Solutions (TN)

FDA Label Image

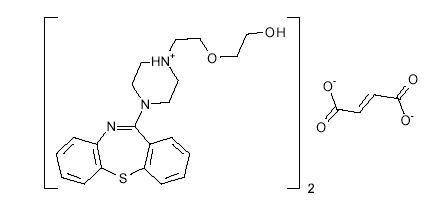
Quetiapine Fumarate Structural Formula (Image 1)

Quetiapine Fumarate Structural Formula (Image 1)
Chemical structure of Quetiapine, showing its bicyclic and piperazine ring system linked with a hydroxyethoxy side chain, presented as two units. The structure also includes an adjacent chemical moiety representing an acid salt form.*
FDA Label Image

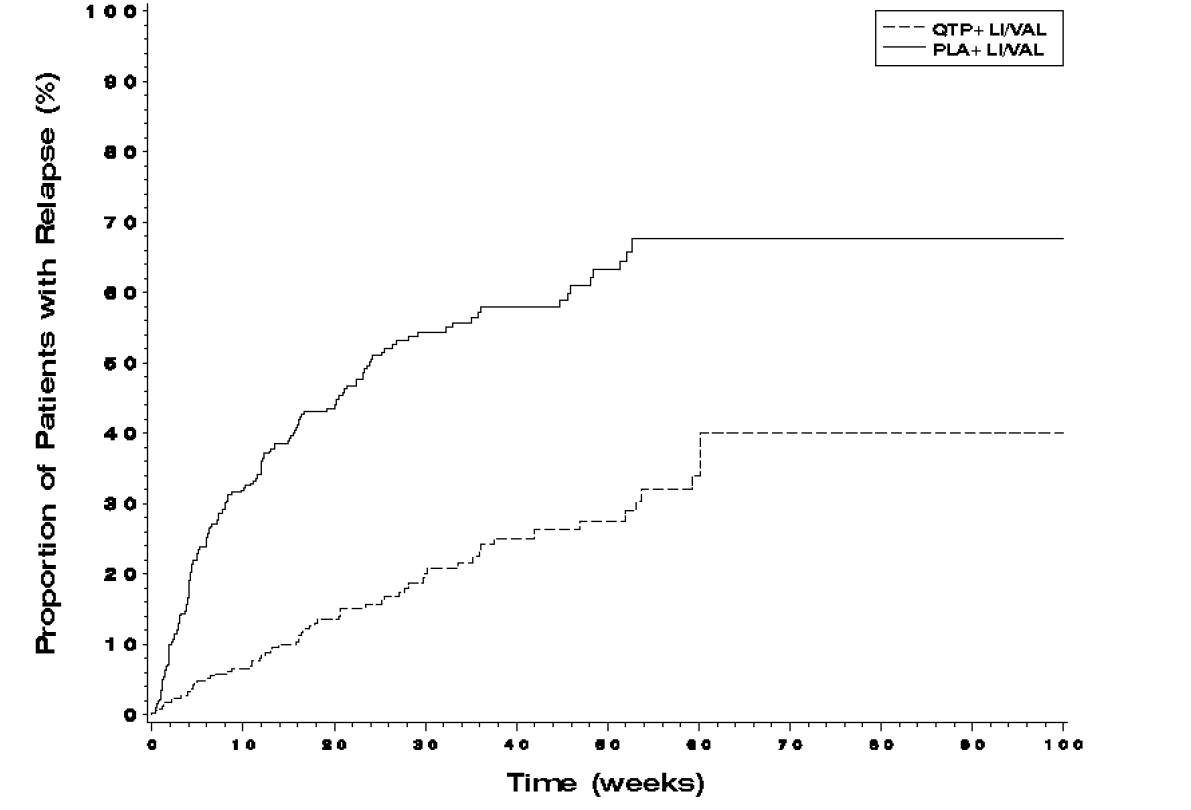
Figure 1 (Image 2)

Figure 1 (Image 2)
A line graph depicting the proportion of patients with relapse (%) over time in weeks, comparing two groups: QTP + LI/VAL (dashed line) and PLA + LI/VAL (solid line). The solid line shows a higher relapse proportion, reaching about 68%, while the dashed line reaches about 40% over approximately 80 weeks.*
FDA Label Image

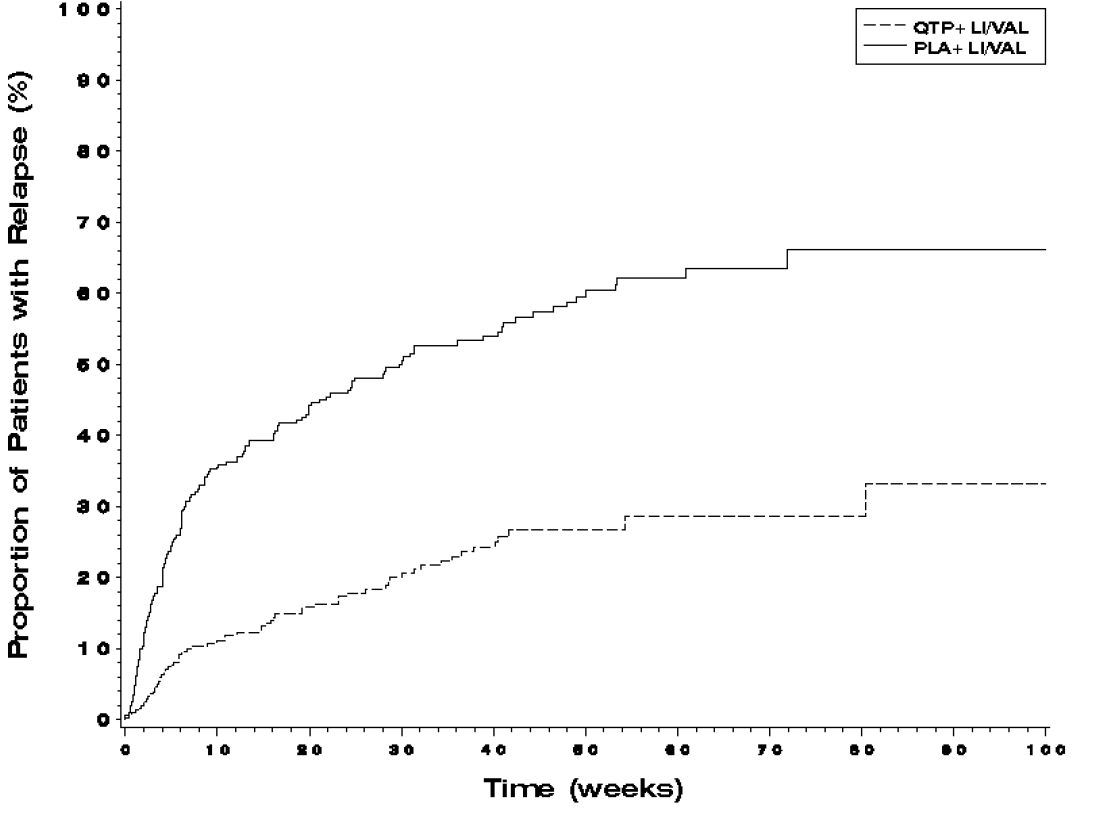
Figure 2 (Image 3)

Figure 2 (Image 3)
A line chart depicting the proportion of patients with relapse over time in weeks. The vertical axis shows the percentage of patients with relapse, ranging from 0 to 100%, while the horizontal axis shows time in weeks up to 100. Two groups are compared: one labeled QTP+ LI/VAL (dashed line) and another labeled PLA+ LI/VAL (solid line), with the proportion of relapse increasing more steeply in the PLA+ LI/VAL group over the study duration.*

* About these descriptions: Image descriptions on this page are generated by automated AI analysis of the product label images from the manufacturer's FDA label submission (SPL). They are provided for reference only and may contain errors or omissions. Always rely on the printed label itself and the official FDA labeling, and consult a pharmacist or healthcare professional with any questions about this product.