Terazosin
Product Images NDC 71610-546

View Photos of Packaging, Regulatory Labels, and Product Appearance

Product Visual Gallery

This gallery contains 6 technical images submitted to the FDA as part of the official labeling for Terazosin (NDC 71610-546). Unlike standard consumer photos, these assets often include clinical data figures, molecular chemical structures, and official manufacturer packaging layouts.

As provided by Aphena Pharma Solutions - Tennessee, Llc, these visuals offer a comprehensive scientific overview of the product's physical and chemical identity, aiding pharmacists and researchers in product verification and study.

FDA Label Image

Bottle Label 10 mg (71610 0546 60)

Bottle Label 10 mg (71610 0546 60)
Terazosin 10 mg capsules label from Aphena Pharma Solutions - Tennessee, LLC. The label includes storage instructions to keep the product between 20-25 degrees Celsius and advises keeping the drug out of reach of children. It lists Jubilant Cadista Pharmaceuticals Inc as the manufacturer and states a package size of 90 capsules. The product is marked Rx only.*

FDA Label Image

Aphena Pharma Solutions (TN)

FDA Label Image

Terazosin Hydrochloride Chemical Structure (Terazosin Hydrochloride Capsules 1)

Terazosin Hydrochloride Chemical Structure (Terazosin Hydrochloride Capsules 1)
Chemical structure diagram of Terazosin hydrochloride showing the molecular arrangement including aromatic rings, piperazine, and oxirane groups with the hydrochloride moiety.*
FDA Label Image

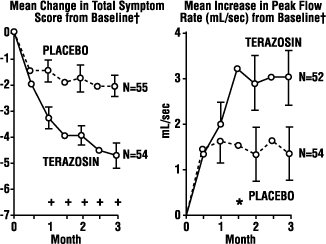
Figure 1 (Terazosin Hydrochloride Capsules 2)

Figure 1 (Terazosin Hydrochloride Capsules 2)
This image shows two line graphs comparing Terazosin and placebo over 3 months. The left graph depicts mean change in total symptom score from baseline, showing a decrease mainly with Terazosin. The right graph shows mean increase in peak flow rate (mL/sec) from baseline, with a greater increase in the Terazosin group. Each graph includes sample sizes and error bars.*
FDA Label Image

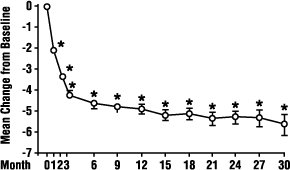
Figure 2 (Terazosin Hydrochloride Capsules 3)

Figure 2 (Terazosin Hydrochloride Capsules 3)
A line graph showing mean change from baseline over a 30-month period. The x-axis is labeled 'Month' with values from 0 to 30, and the y-axis shows mean change ranging from 0 to -7. Two lines represent different groups or conditions with data points marked, some marked with asterisks indicating statistical significance.*
FDA Label Image

Figure 3 (Terazosin Hydrochloride Capsules 4)

Figure 3 (Terazosin Hydrochloride Capsules 4)
A line graph showing mean change from baseline in mL/sec over a 30-month period. Data points at various months are plotted with error bars indicating variability. Several points are marked with asterisks, indicating statistical significance or notable change.*

* About these descriptions: Image descriptions on this page are generated by automated AI analysis of the product label images from the manufacturer's FDA label submission (SPL). They are provided for reference only and may contain errors or omissions. Always rely on the printed label itself and the official FDA labeling, and consult a pharmacist or healthcare professional with any questions about this product.