Product Images Pregabalin

View Photos of Packaging, Labels & Appearance

Product Label Images

The following 16 images provide visual information about the product associated with Pregabalin NDC 71610-618 by Aphena Pharma Solutions - Tennessee, Llc, such as packaging, labeling, and the appearance of the drug itself. This resource could be helpful for medical professionals, pharmacists, and patients seeking to verify medication information and ensure they have the correct product.

Bottle Label 150 mg - 71610 0618 53

Bottle Label 150 mg - 71610 0618 53

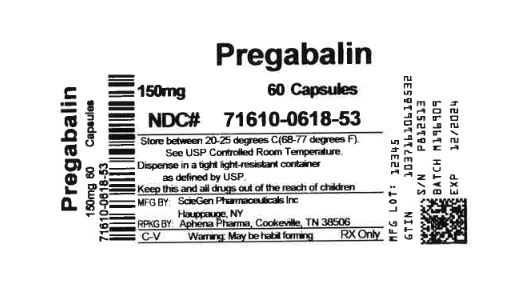
This is a medication called Pregabalin. The package contains 60 capsules, each with a strength of 50mg. The NDC number is 71610-0618-53. There is also some information about storage temperature and identification of the lot and batch numbers.*

Bottle Label 50 mg - 71610 0619 53

Bottle Label 50 mg - 71610 0619 53

The text contains information that appears to be related to a medicine called Pregabalin with a quantity of 60 capsules, a batch number of 71810.0870.83 and an expiration date of 12/2084. It is not possible to determine any additional information or instructions without further context.*

Aphena Pharma Solutions - TN - Aphena

Aphena Pharma Solutions - TN - Aphena

Figure 1 - pregabalin fig01

Figure 1 - pregabalin fig01

Figure 2 - pregabalin fig02

Figure 2 - pregabalin fig02

This seems to be a table showing the percentage improvement in pain from baseline for patients who took Pregabalin 160mg for three days. There are numbers ranging from 2 to 100 indicating the percentage of improvement for different patients. However, the rest of the text is not readable and leaves little context for further interpretation.*

Figure 3 - pregabalin fig03

Figure 3 - pregabalin fig03

Figure 4 - pregabalin fig04

Figure 4 - pregabalin fig04

Figure 5 - pregabalin fig05

Figure 5 - pregabalin fig05

This appears to be a table displaying the results of a study involving the administration of Fregabalin 100mg, Pregataiin 80mg, and a placebo to patients. The table shows the number of patients who improved after the treatment and the percent improvement in pain from baseline.*

Figure 6 - pregabalin fig06

Figure 6 - pregabalin fig06

The text seems to be a table containing two study names - E1 and E3, and a dosage list including Placebo SOmgday, 150mgday, 300mgday, and 600mgday. The table also shows that the study participants were given either Placebo, 300mg/day, or 600mg/day, and the results were statistically significant compared to the Placebo group. Therefore, the text appears to be related to a medical study testing different dosages of a drug.*

Figure 7 - pregabalin fig07

Figure 7 - pregabalin fig07

Figure 9 - pregabalin fig08

Figure 9 - pregabalin fig08

The text shows a graph that displays the percent of patients improved in relation to the daily dose of Pregabalin (300mg or 450mg) and the placebo. The horizontal axis shows the percent improvement in pain from baseline, while the vertical axis displays the percentage of patients who experienced improvement. No additional information is available.*

Figure 10 - pregabalin fig09

Figure 10 - pregabalin fig09

This is a table presenting the estimated percentage of subjects without LTR (likely related to a medical trial). The table indicates different percentages that range from 0% to 100% and includes two groups, Progabain and Placebo. The columns on the right side of the table display different days, from day 0 to day 180. No further information is given.*

Figure 11 - pregabalin fig10

Figure 11 - pregabalin fig10

Figure 12 - pregabalin fig11

Figure 12 - pregabalin fig11

Cockcroft and Gault equation - pregabalin formula

Cockcroft and Gault equation - pregabalin formula

The given text is a medical formula used to calculate the creatinine clearance rate (CLCT) in patients. It uses the patient's age and weight in kilograms to calculate an intermediate result (mmmmmmmmm e e) which is multiplied by 0.85 in the case of female patients. The final step in the formula involves multiplying the result by the patient's serum creatinine level measured in milligrams per deciliter (mg/dL).*

Chemical Structure - pregabalin str

Chemical Structure - pregabalin str

* The product label images have been analyzed using a combination of traditional computing and machine learning techniques. It should be noted that the descriptions provided may not be entirely accurate as they are experimental in nature. Use the information in this page at your own discretion and risk.