Xarelto Tablet, Film Coated
Product Images NDC 71610-690

View Photos of Packaging, Regulatory Labels, and Product Appearance

Product Visual Gallery

This gallery contains 35 technical images submitted to the FDA as part of the official labeling for Xarelto (NDC 71610-690). Unlike standard consumer photos, these assets often include clinical data figures, molecular chemical structures, and official manufacturer packaging layouts.

As provided by Aphena Pharma Solutions - Tennessee, Llc, these visuals offer a comprehensive scientific overview of the product's physical and chemical identity, aiding pharmacists and researchers in product verification and study.

FDA Label Image

Bottle Label 10 mg (71610 0690 42)

Bottle Label 10 mg (71610 0690 42)
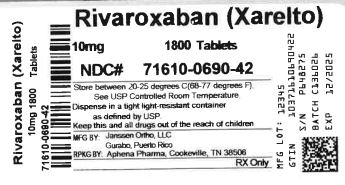
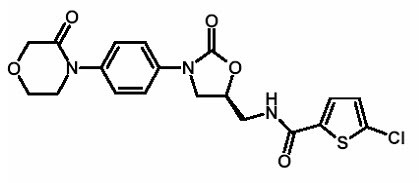
This is a medication called Ivaroxaban, which is also known as Xarelto. The bottle contains 1800 tablets of 10 milligrams each with a National Drug Code (NDC) number of 71610-0690-42. The other information appears to be illegible or not available.*
FDA Label Image

Aphena Pharma Solutions (TN)

FDA Label Image

Figure 1 (Xarelto 01)

Figure 1 (Xarelto 01)
This is a table of data with percentages related to patient characteristics, such as prior use of warfarin, age, gender, weight, diabetes status, CHADS2 score, geographic region, ASA use at randomization, and treatment with either rivaroxaban or warfarin. It also includes hazard ratio and 95% confidence intervals related to favoring treatment with rivaroxaban over warfarin. No further information or context is available.*
FDA Label Image

Chemical Structure (Xarelto 02)

FDA Label Image

Figure 2 (Xarelto 03)

Figure 2 (Xarelto 03)
This text contains pharmacokinetic (PK) information for the drug rivaroxaban in different populations. It provides fold change and 90% confidence interval for the PK parameters Cmax and AUC post dose. The populations evaluated include those with end-stage renal disease (ESRD), renal impairment, variations in age and body weight, and hepatic impairment. The results are specific to those with creatinine clearance levels ranging from severe to normal, and the ESRD data represents subjects maintained with chronic and stable hemodialysis.*
FDA Label Image

Figure 3 (Xarelto 04)

Figure 3 (Xarelto 04)
This is a table of drug interactions and their effect on the pharmacokinetics (PK) of different drugs, specifically their maximum concentration (Cmax) and area under the concentration-time curve (AUC). The first section refers to combined inhibitors of the P-glycoprotein (P-gp) transporter and the CYP3A enzyme, while the second section refers to moderate CYP3A inhibitors and other drugs. The last row shows the fold change in the PK parameters compared to the drug rivaroxaban alone.*
FDA Label Image

Figure 4 (Xarelto 05)

FDA Label Image

Figure 5 (Xarelto 06)

FDA Label Image

Figure 6 (Xarelto 07)

FDA Label Image

Figure 7 (Xarelto 08)

FDA Label Image

Figure 8 (Xarelto 09)

FDA Label Image

Figure 9 (Xarelto 10)

Figure 9 (Xarelto 10)
This appears to be a statistical table providing data on the effectiveness of XARELTO in comparison to placebo across different age groups, weight range, and medical history. The efficacy of XARELTO was measured by a composite outcome of stroke and death from cardiovascular causes. The table also includes data on the characteristics of the study population, including age, sex, geographical location, weight range, and medical history of heart attack, diabetes, and heart-taker.*
FDA Label Image

Figure 10 (Xarelto 11)

Figure 10 (Xarelto 11)
This appears to be a graph showing the cumulative incidence rate of XARELTO versus a placebo over a period of 1095 days from randomization. The graph shows the percentage of subjects at risk and the number of subjects at risk. The vertical axis shows the cumulative incidence rate in percentage while the horizontal axis shows the number of days from randomization.*
FDA Label Image

Figure 11 (Xarelto 12)

Figure 11 (Xarelto 12)
The text provided seems to be a table presenting data on Cumulative Incidence Rate (%) for a comparison between XARELTO and Placebo. The table divides the data into two treatment groups and presents a comparison under "Hazard Ratio (55% C)." The table includes data related to the number of subjects at risk and days from randomization. No additional information is available to provide a more detailed description.*
FDA Label Image

Figure 12 (Xarelto 13)

Figure 12 (Xarelto 13)
Not available.*
FDA Label Image

Image (Xarelto 14)

FDA Label Image

Image (Xarelto 15)

FDA Label Image

Image (Xarelto 16)

FDA Label Image

Image (Xarelto 17)

FDA Label Image

Image (Xarelto 18)

Image (Xarelto 18)
The text is not-available because there is not enough information to generate a useful description.*
FDA Label Image

Image (Xarelto 19)

Image (Xarelto 19)
This text is a prompt to check and mark the expiration date of a product with the message "Discard after".*
FDA Label Image

Image (Xarelto 20)

FDA Label Image

Image (Xarelto 21)

FDA Label Image

Image (Xarelto 22)

FDA Label Image

Image (Xarelto 23)

FDA Label Image

Image (Xarelto 24)

Image (Xarelto 24)
This text appears to be a table or list showing various measurements in milliliters (mL) and the composition of each measurement in terms of smaller volumes of 5mL. Without further context, it is difficult to determine what the purpose or meaning of this information is.*
FDA Label Image

Image (Xarelto 25)

FDA Label Image

Image (Xarelto 26)

FDA Label Image

Image (Xarelto 27)

FDA Label Image

Image (Xarelto 28)

FDA Label Image

Image (Xarelto 29)

FDA Label Image

Image (Xarelto 30)

FDA Label Image

Image (Xarelto 31)

FDA Label Image

Image (Xarelto 32)

FDA Label Image

Image (Xarelto 33)

* These product label images have been analyzed using experimental machine learning. Please verify findings with the primary label text.