Amlodipine Besylate Tablet
Product Images NDC 71610-691

View Photos of Packaging, Regulatory Labels, and Product Appearance

Product Visual Gallery

This gallery contains 5 technical images submitted to the FDA as part of the official labeling for Amlodipine Besylate (NDC 71610-691). Unlike standard consumer photos, these assets often include clinical data figures, molecular chemical structures, and official manufacturer packaging layouts.

As provided by Aphena Pharma Solutions - Tennessee, Llc, these visuals offer a comprehensive scientific overview of the product's physical and chemical identity, aiding pharmacists and researchers in product verification and study.

FDA Label Image

Bottle Label 5 mg (71610 0691 15)
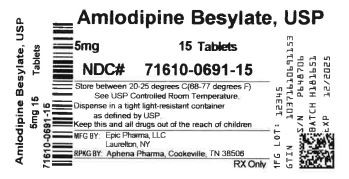
Bottle Label 5 mg (71610 0691 15)
Amlodipine Besylate USP 5 mg oral tablets packaging label showing 15 tablets per container. Label includes product NDC 71610-0691-15, manufacturer as Aphena Pharma Solutions - Tennessee, LLC, and storage instructions to keep at controlled room temperature and out of reach of children. Also displays lot number, expiration date, and barcode.*

FDA Label Image

Aphena Pharma Solutions (TN)

FDA Label Image

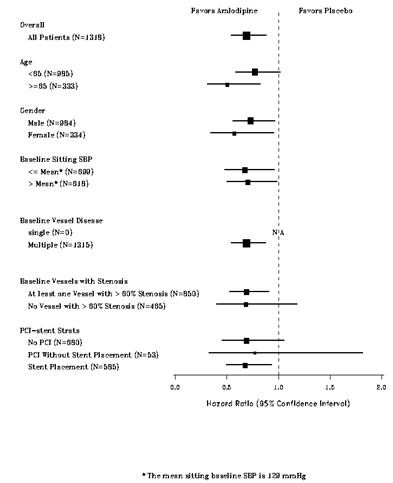
Effects-on-primary-endpoint-of-amlodipine (Effects On Primary Endpoint Of Amlodipine)

Effects-on-primary-endpoint-of-amlodipine (Effects On Primary Endpoint Of Amlodipine)
A forest plot illustrating hazard ratios with 95% confidence intervals comparing the effects of Amlodipine versus placebo across various patient subgroups. Subgroups include overall patients, age groups (<65 and ≥65), gender (male and female), baseline sitting systolic blood pressure (above and below mean), baseline vessel disease (single and multiple), baseline vessels with stenosis (presence or absence of ≥50% stenosis), and PCI-stent status (no PCI, PCI without stent, stent placement). The plot shows point estimates and confidence intervals around the hazard ratio of 1, indicating relative risk comparisons.*
FDA Label Image

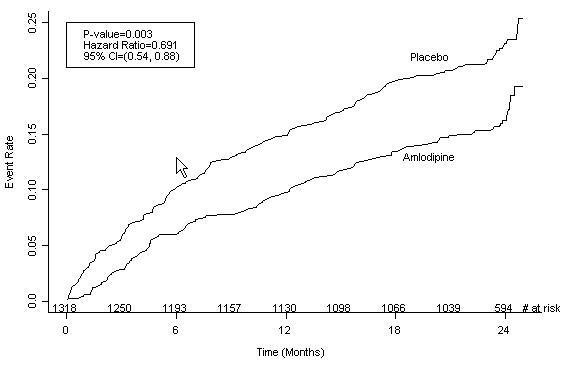
Kaplan-meier-analysis (Kaplan Meier Analysis)

Kaplan-meier-analysis (Kaplan Meier Analysis)
A Kaplan-Meier curve chart showing event rates over time (months) comparing Amlodipine to Placebo. The graph includes a p-value, hazard ratio, and 95% confidence interval, illustrating event rate trends for both groups across a 24-month period with numbers at risk indicated.*
FDA Label Image

Structural-formula-of-amlodipine-besylate (Structural Formula)

Structural-formula-of-amlodipine-besylate (Structural Formula)
Chemical structure diagram of amlodipine besylate, showing its molecular framework with labeled chemical groups including chlorine, methyl, ethyl, and sulfonate moieties, corresponding to the active ingredient amlodipine besylate.*

* About these descriptions: Image descriptions on this page are generated by automated AI analysis of the product label images from the manufacturer's FDA label submission (SPL). They are provided for reference only and may contain errors or omissions. Always rely on the printed label itself and the official FDA labeling, and consult a pharmacist or healthcare professional with any questions about this product.