Quetiapine Tablet, Film Coated
Product Images NDC 71610-702

View Photos of Packaging, Regulatory Labels, and Product Appearance

Product Visual Gallery

This gallery contains 14 technical images submitted to the FDA as part of the official labeling for Quetiapine (NDC 71610-702). Unlike standard consumer photos, these assets often include clinical data figures, molecular chemical structures, and official manufacturer packaging layouts.

As provided by Aphena Pharma Solutions - Tennessee, Llc, these visuals offer a comprehensive scientific overview of the product's physical and chemical identity, aiding pharmacists and researchers in product verification and study.

FDA Label Image

Bottle Label 200 mg (71610 0702 15)
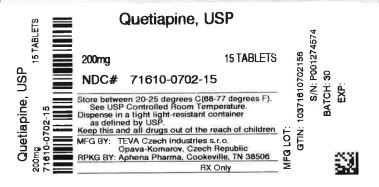
Bottle Label 200 mg (71610 0702 15)
Label for Quetiapine USP 200 mg film-coated tablets, containing 15 tablets. The label includes storage instructions, manufacturer details (Aphena Pharma Solutions - Tennessee, LLC), and product identifiers such as NDC 71610-0702-15 and batch information.*

FDA Label Image

Aphena Pharma Solutions (TN)

FDA Label Image

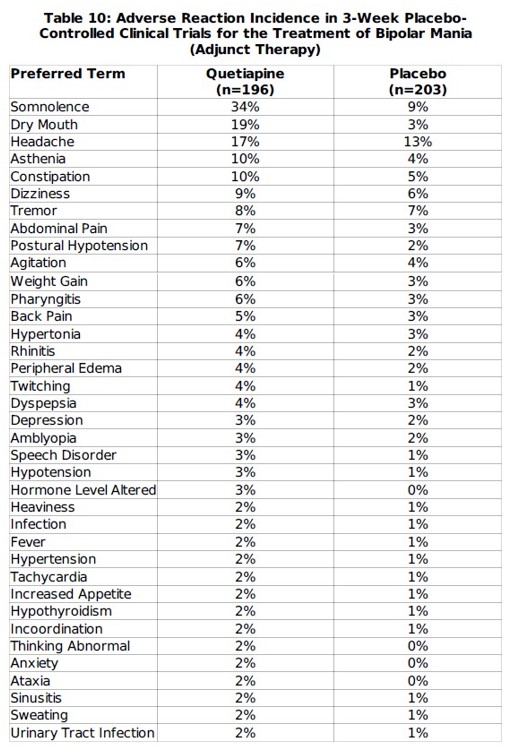
10 (Table 10)

10 (Table 10)
Data table presenting the incidence of adverse reactions in 3-week placebo-controlled clinical trials for bipolar mania treatment with Quetiapine versus placebo. The table lists preferred terms for side effects with corresponding percentages for Quetiapine (n=196) and placebo (n=203), showing higher rates of somnolence, dry mouth, headache, and other reactions in the Quetiapine group.*
FDA Label Image

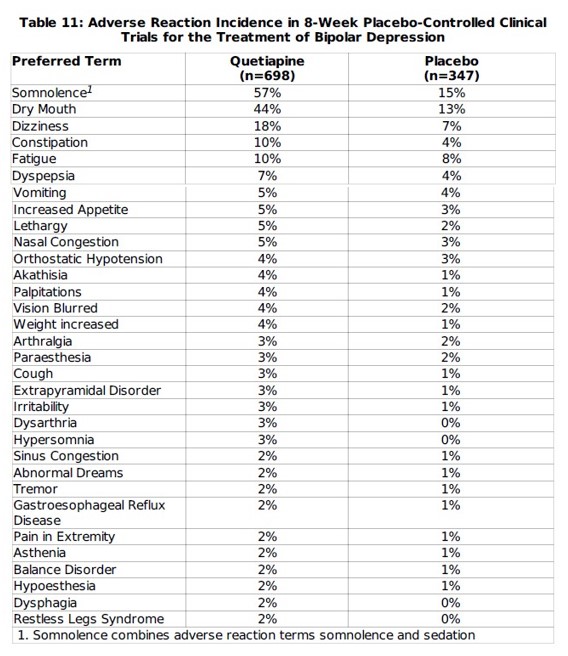
11 (Table 11)

11 (Table 11)
Table showing adverse reaction incidence in 8-week placebo-controlled clinical trials for bipolar depression treatment comparing Quetiapine (n=698) and placebo (n=347). It lists various adverse reactions with their respective percentages of occurrence in each group, highlighting higher rates in the Quetiapine group across many symptoms such as somnolence, dry mouth, and dizziness.*
FDA Label Image

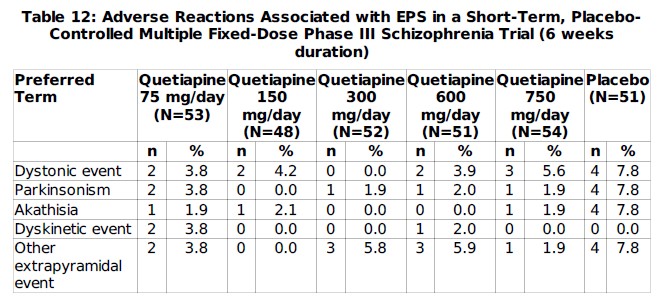
12 (Table 12)

12 (Table 12)
A table summarizing adverse reactions associated with extrapyramidal symptoms (EPS) from a Phase III schizophrenia trial over 6 weeks. It compares incidences (%) of dystonic event, parkinsonism, akathisia, dyskinetic event, and other extrapyramidal events across five Quetiapine treatment groups (75, 150, 300, 600, 750 mg/day) and a placebo group, with corresponding sample sizes (N) listed.*
FDA Label Image

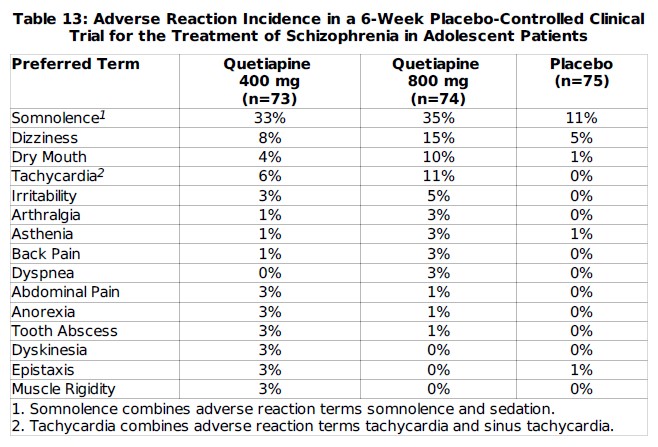
13 (Table 13)

13 (Table 13)
Table displaying adverse reaction incidence percentages in a 6-week placebo-controlled clinical trial for schizophrenia treatment in adolescent patients. It compares the occurrence of various side effects between Quetiapine 400 mg, Quetiapine 800 mg, and placebo groups, listing symptoms such as somnolence, dizziness, dry mouth, and others with respective incidence rates.*
FDA Label Image

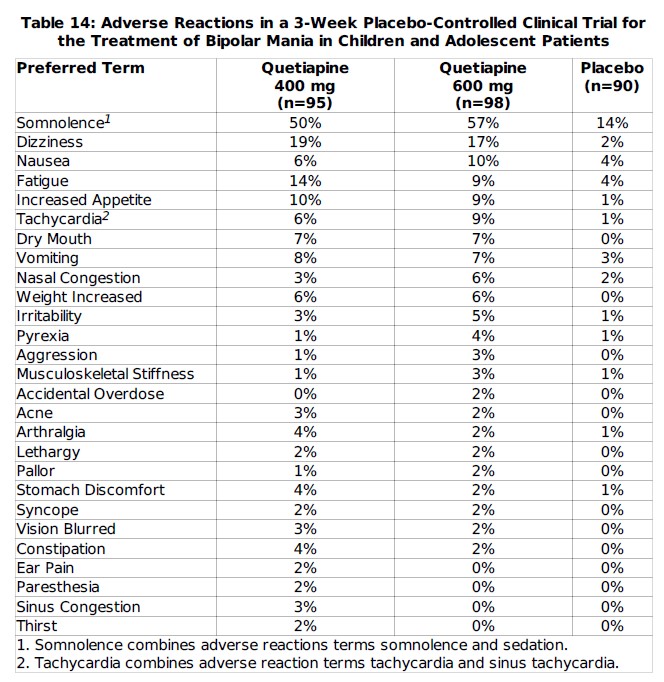
14 (Table 14)

14 (Table 14)
A table presenting adverse reactions reported in a 3-week placebo-controlled clinical trial comparing Quetiapine 400 mg, Quetiapine 600 mg, and placebo in treating bipolar mania in children and adolescents. The table lists various side effects with their incidence percentages across the three groups, including common events such as somnolence, dizziness, nausea, and fatigue.*
FDA Label Image

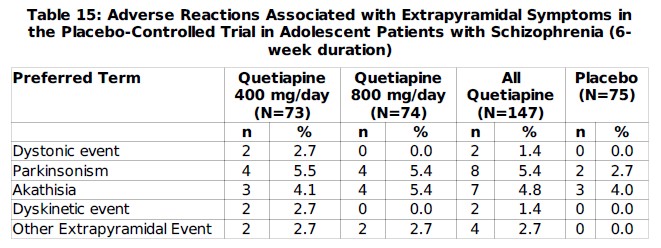
14 (Table 15)

14 (Table 15)
A data table titled 'Adverse Reactions Associated with Extrapyramidal Symptoms in the Placebo-Controlled Trial in Adolescent Patients with Schizophrenia (6-week duration).' It compares the frequency and percentage of preferred adverse reactions between Quetiapine 400 mg/day, Quetiapine 800 mg/day, all Quetiapine doses combined, and placebo groups, listing events such as dystonic event, parkinsonism, akathisia, dyskinetic event, and other extrapyramidal events.*
FDA Label Image

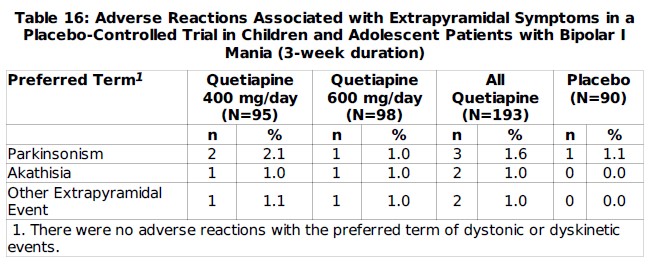
16 (Table 16)

16 (Table 16)
A data table titled 'Adverse Reactions Associated with Extrapyramidal Symptoms in a Placebo-Controlled Trial in Children and Adolescent Patients with Bipolar I Mania (3-week duration).' It compares the occurrence of parkinsonism, akathisia, and other extrapyramidal events across groups receiving Quetiapine 400 mg/day, 600 mg/day, all Quetiapine doses combined, and placebo, showing the number and percentage of patients affected in each group.*
FDA Label Image

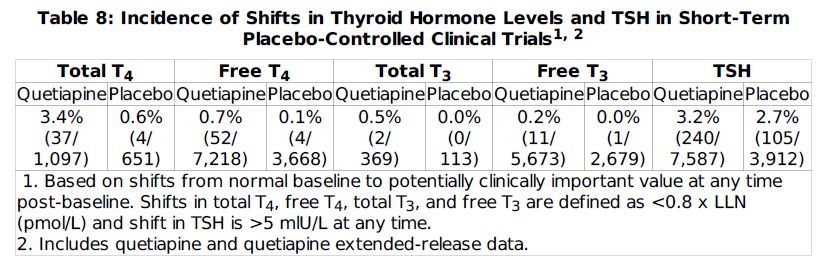
8 (Table 8)

8 (Table 8)
Data table titled 'Incidence of Shifts in Thyroid Hormone Levels and TSH in Short-Term Placebo-Controlled Clinical Trials' comparing Quetiapine and placebo groups. It includes columns for Total T4, Free T4, Total T3, Free T3, and TSH, with incidence percentages and sample sizes noted. Footnotes explain definitions of shifts and data inclusion criteria.*
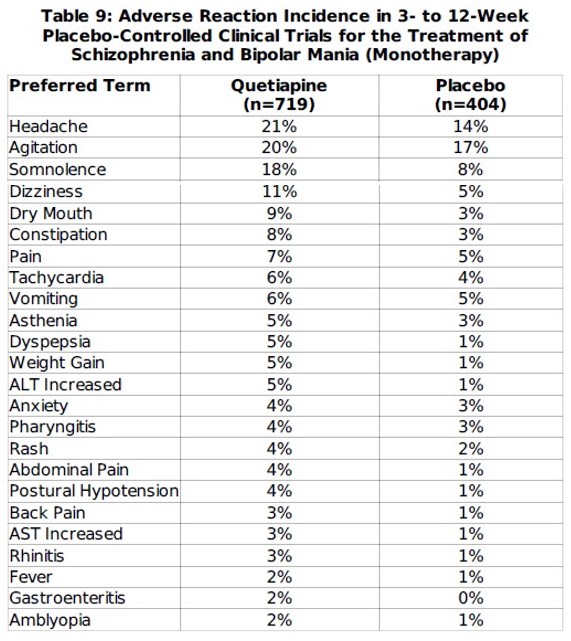
FDA Label Image

9 (Table 9)

9 (Table 9)
A data table titled 'Adverse Reaction Incidence in 3- to 12-Week Placebo-Controlled Clinical Trials for the Treatment of Schizophrenia and Bipolar Mania (Monotherapy).' It compares the incidence percentages of various adverse reactions for Quetiapine (n=719) against Placebo (n=404), listing terms such as headache, agitation, somnolence, dizziness, dry mouth, and others, with higher percentages generally seen in the Quetiapine group.*
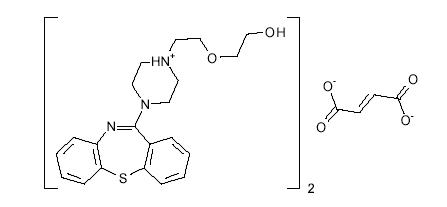
FDA Label Image

Quetiapine Fumarate Structural Formula (Image 1)

Quetiapine Fumarate Structural Formula (Image 1)
Chemical structure of Quetiapine, showing its molecular framework along with an associated salt component.*
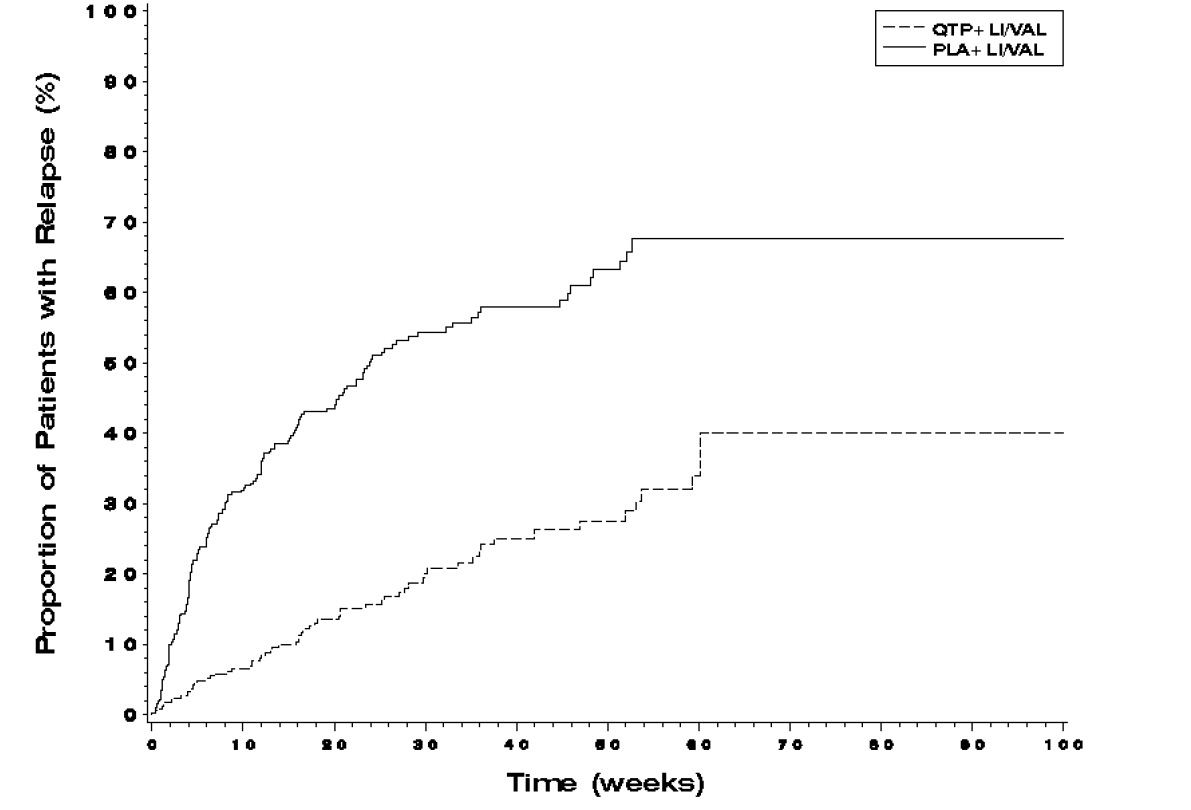
FDA Label Image

Figure 1 (Image 2)

Figure 1 (Image 2)
A line graph depicting the proportion of patients with relapse (%) over time in weeks. The graph compares two groups: QTP+LI/VAL (dashed line) and PLA+LI/VAL (solid line). The vertical axis shows relapse proportion from 0% to 100%, and the horizontal axis spans from 0 to 100 weeks.*
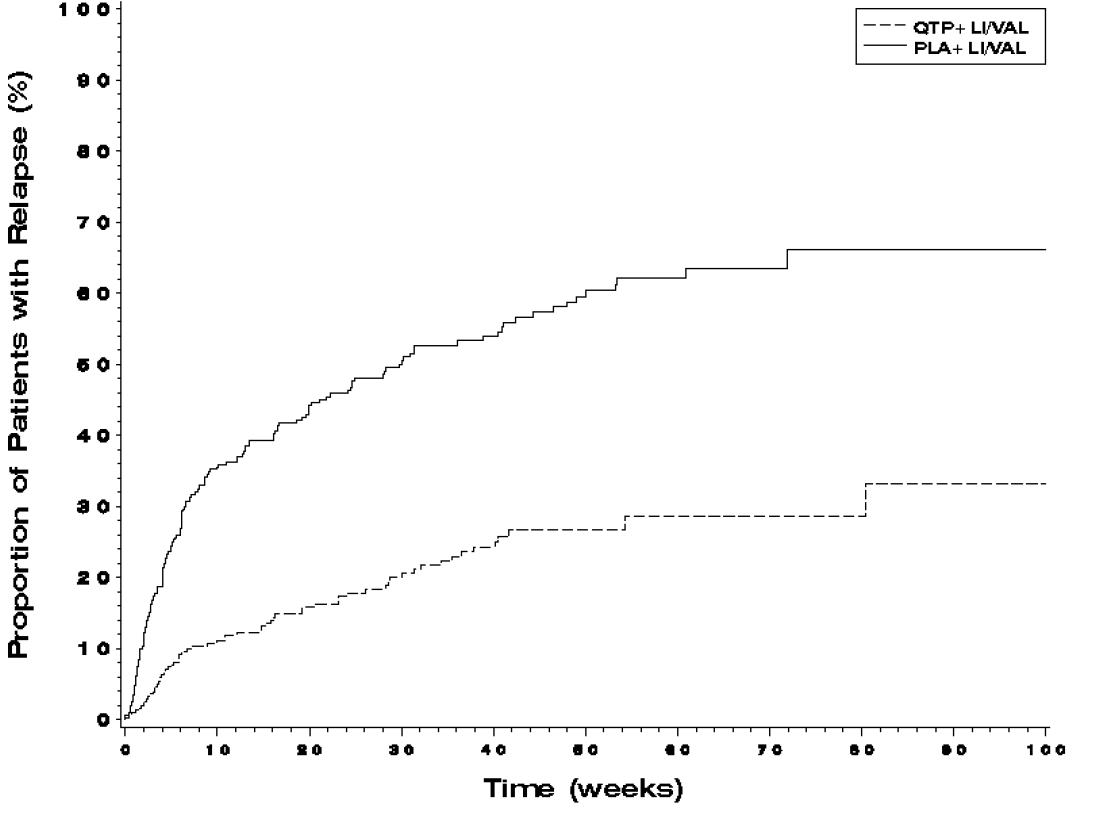
FDA Label Image

Figure 2 (Image 3)

Figure 2 (Image 3)
A line graph showing the proportion of patients with relapse (%) over time in weeks. Two groups are compared: QTP+ LI/VAL (dashed line) and PLA+ LI/VAL (solid line). The graph illustrates relapse rates increasing over approximately 90 weeks, with the PLA+ LI/VAL group showing a higher relapse proportion than the QTP+ LI/VAL group throughout the period.*

* About these descriptions: Image descriptions on this page are generated by automated AI analysis of the product label images from the manufacturer's FDA label submission (SPL). They are provided for reference only and may contain errors or omissions. Always rely on the printed label itself and the official FDA labeling, and consult a pharmacist or healthcare professional with any questions about this product.