Product Images Divalproex Sodium

View Photos of Packaging, Labels & Appearance

Product Label Images

The following 6 images provide visual information about the product associated with Divalproex Sodium NDC 71610-707 by Aphena Pharma Solutions - Tennessee, Llc, such as packaging, labeling, and the appearance of the drug itself. This resource could be helpful for medical professionals, pharmacists, and patients seeking to verify medication information and ensure they have the correct product.

Bottle Label 500 mg - 71610 0707 53

Bottle Label 500 mg - 71610 0707 53

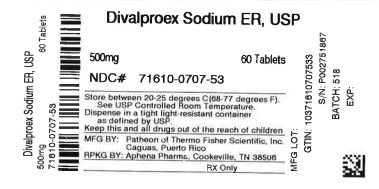
This appears to be a medication label or prescription information. The medication is called Divalproex Sodium ER, USP. There is a reference to an NDC number, which is a unique identifier for drugs in the United States. The rest of the text is not clear due to errors produced by the process. Therefore, the full and accurate description cannot be provided.*

Aphena Pharma Solutions - TN - Aphena

Aphena Pharma Solutions - TN - Aphena

Divalproex Structural Formula - image 03

Divalproex Structural Formula - image 03

Figure 1: Proportion of patients (X axis) whose percentage reduction from baseline in complex partial seizure rates was at least as great as that indicated on the Y axis in the adjunctive therapy study - image 04

Figure 1: Proportion of patients (X axis) whose percentage reduction from baseline in complex partial seizure rates was at least as great as that indicated on the Y axis in the adjunctive therapy study - image 04

This is a chart that shows the percentage reduction in the CP$ rate categorized by the percentage of patients experiencing improvement, worsening, or no change. There is not enough context to provide further information about what CP$ rate refers to.*

Figure 2: Proportion of patients (X axis) whose percentage reduction from baseline in complex partial seizure rates was at least as great as that indicated on the Y axis in the monotherapy study - image 05

Figure 2: Proportion of patients (X axis) whose percentage reduction from baseline in complex partial seizure rates was at least as great as that indicated on the Y axis in the monotherapy study - image 05

This appears to be a graph displaying the effectiveness of different doses of a drug with delayed release. The drug is likely divalproex sodium. The graph shows that a high dose (50-100%) is associated with a higher percentage of patients experiencing a positive effect from the drug, while a low dose (0-2%) is less effective. There may also be a group of patients for whom there is no change in their condition (0%). However, it's difficult to interpret the graph without more context.*

Figure 3. Mean Reduction in 4-Week Migraine Headache Rates - image 06

Figure 3. Mean Reduction in 4-Week Migraine Headache Rates - image 06

* The product label images have been analyzed using a combination of traditional computing and machine learning techniques. It should be noted that the descriptions provided may not be entirely accurate as they are experimental in nature. Use the information in this page at your own discretion and risk.