Rosuvastatin Calcium Tablet
Product Images NDC 71610-801

View Photos of Packaging, Regulatory Labels, and Product Appearance

Product Visual Gallery

This gallery contains 17 technical images submitted to the FDA as part of the official labeling for Rosuvastatin Calcium (NDC 71610-801). Unlike standard consumer photos, these assets often include clinical data figures, molecular chemical structures, and official manufacturer packaging layouts.

As provided by Aphena Pharma Solutions - Tennessee, Llc, these visuals offer a comprehensive scientific overview of the product's physical and chemical identity, aiding pharmacists and researchers in product verification and study.

FDA Label Image

Label (71610 801 45)

Label (71610 801 45)
The packaging label for Rosuvastatin USP 10 mg oral tablets, containing 45 tablets. The label includes the NDC number 71610-801-45, storage instructions to keep between 20-25 degrees Celsius, and a safety warning to keep out of reach of children. The manufacturer is listed as Puracap Caribe in Dorado, PR, and the repackager is Aphena Pharma in Cookeville, TN 38506. It also includes barcode and batch information sections.*

FDA Label Image

Aphena (Aphena)

FDA Label Image

Figure1.jpg (Figure1)

Figure1.jpg (Figure1)
A box plot chart showing percent change from baseline in LDL-C for different doses of four statin drugs: CRESTOR, Atorvastatin, Simvastatin, and Pravastatin. The x-axis displays doses in milligrams, and the y-axis shows percent change from 0 to -75, indicating LDL-C reduction.*
FDA Label Image

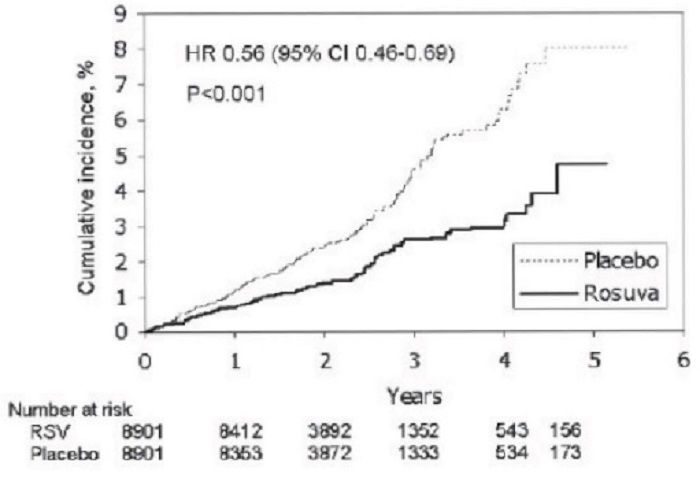
Figure2.jpg (Figure2)

Figure2.jpg (Figure2)
A cumulative incidence line graph comparing the percentage incidence over years between Placebo and Rosuva (Rosuvastatin). The graph shows time in years along the x-axis and cumulative incidence in percentage along the y-axis. Rosuva demonstrates a consistently lower incidence compared to Placebo over a 5-year period, with hazard ratio (HR) 0.56, 95% confidence interval 0.46-0.69, and p-value less than 0.001. Number at risk data is provided at various time points for both groups.*
FDA Label Image

Figure3.jpg (Figure3)

Figure3.jpg (Figure3)
A forest plot comparing event rates and hazard ratios (HR with 95% confidence intervals) between Rosuva 20 mg and placebo 20 mg groups for various cardiovascular endpoints, including primary endpoint (MCE), cardiovascular death, nonfatal stroke, nonfatal myocardial infarction (MI), hospitalized unstable angina, and arterial revascularization. The plot shows HR values and P values for each endpoint with corresponding confidence intervals.*
FDA Label Image

Structure-formula.jpg (Structure Formula)

Structure-formula.jpg (Structure Formula)
Chemical structure of rosuvastatin calcium, illustrating the molecular arrangement of this active ingredient in the tablet product.*
FDA Label Image

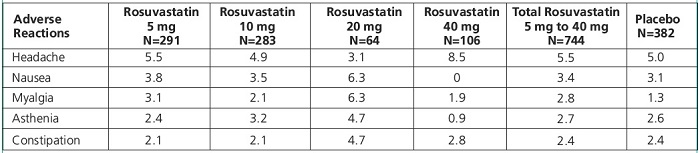
Table1.jpg (Table1)

Table1.jpg (Table1)
A table presenting adverse reaction percentages for Rosuvastatin at 5 mg, 10 mg, 20 mg, 40 mg doses, combined total (5 mg to 40 mg), and placebo groups. Reactions listed include headache, nausea, myalgia, asthenia, and constipation with respective incidence rates for each group.*
FDA Label Image

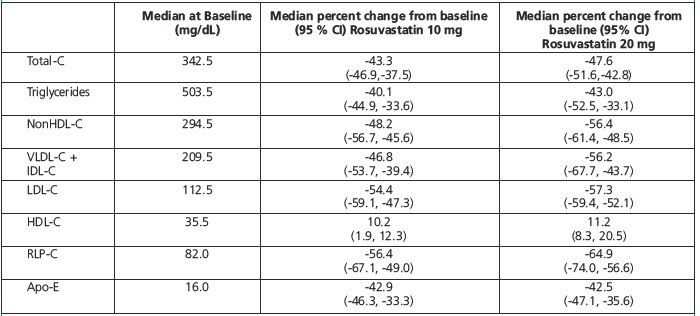
Table10.jpg (Table10)

Table10.jpg (Table10)
A data table presenting median baseline values (mg/dL) and median percent changes from baseline with 95% confidence intervals for various lipid and lipoprotein parameters. The table compares effects of Rosuvastatin 10 mg and 20 mg on Total-C, Triglycerides, NonHDL-C, VLDL-C+IDL-C, LDL-C, HDL-C, RLP-C, and Apo-E.*
FDA Label Image

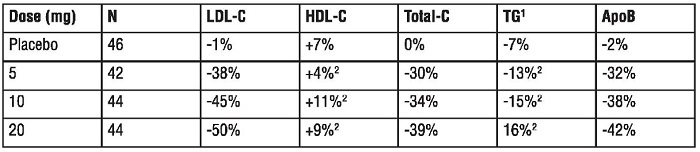
Table12.jpg (Table12)

Table12.jpg (Table12)
A data table showing the effects of different doses of a drug versus placebo on lipid-related biomarkers including LDL-C, HDL-C, Total-C, TG, and ApoB. The table shows percent changes for doses of placebo, 5 mg, 10 mg, and 20 mg, with corresponding sample sizes (N) for each group.*
FDA Label Image

Table2.jpg (Table2)

Table2.jpg (Table2)
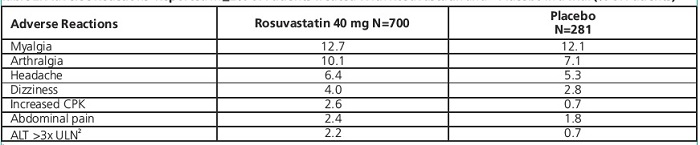
A data table comparing the percentage incidence of various adverse reactions between groups receiving Rosuvastatin 40 mg (N=700) and placebo (N=281). Adverse reactions listed include myalgia, arthralgia, headache, dizziness, increased CPK, abdominal pain, and ALT elevation greater than three times the upper limit of normal.*
FDA Label Image

Table3.jpg (Table3)

Table3.jpg (Table3)
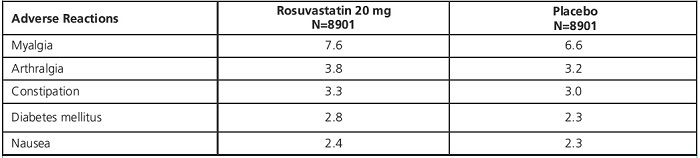
A data table comparing the incidence of selected adverse reactions between Rosuvastatin 20 mg and placebo groups, with values showing percentages of patients experiencing myalgia, arthralgia, constipation, diabetes mellitus, and nausea.*
FDA Label Image

Table4.jpg (Table4)

Table4.jpg (Table4)
A data table showing the pharmacokinetic interactions of rosuvastatin when coadministered with various drugs and dosing regimens. It lists the coadministered drugs and doses, along with the mean ratio change in rosuvastatin AUC and Cmax compared to rosuvastatin alone, indicating magnitude of interaction effects.*
FDA Label Image

Table5.jpg (Table5)

Table5.jpg (Table5)
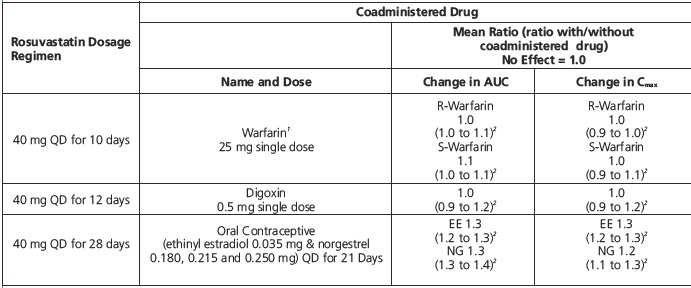
Data table showing the effect of coadministered drugs on Rosuvastatin pharmacokinetics for various dosage regimens. It lists coadministered drugs including Warfarin, Digoxin, and Oral Contraceptives, and displays mean ratio changes in AUC and Cmax with and without the coadministered drugs over different Rosuvastatin dosing durations.*
FDA Label Image

Table6.jpg (Table6)

Table6.jpg (Table6)
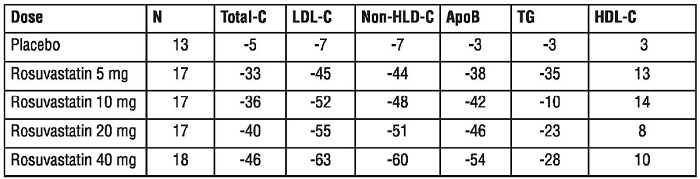
A data table showing the effects of varying doses of Rosuvastatin (5 mg to 40 mg) and placebo on lipid parameters including Total-C, LDL-C, Non-HDL-C, ApoB, TG, and HDL-C with sample sizes (N) for each dose group.*
FDA Label Image

Table7.jpg (Table7)

Table7.jpg (Table7)
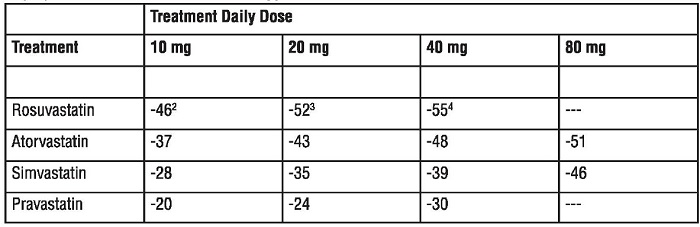
A data table comparing treatment daily doses of four statin medications: Rosuvastatin, Atorvastatin, Simvastatin, and Pravastatin at 10 mg, 20 mg, 40 mg, and 80 mg dosages. The table shows numerical values corresponding to each medication and dosage level, with some blank entries for higher doses of Rosuvastatin and Pravastatin.*
FDA Label Image

Table8.jpg (Table8)

Table8.jpg (Table8)
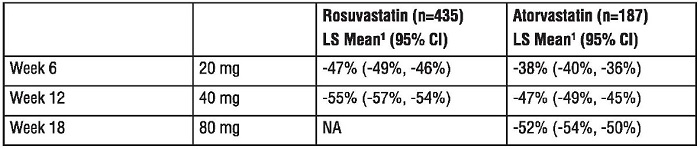
A data table comparing percent change from baseline in LDL cholesterol between Rosuvastatin and Atorvastatin at weeks 6, 12, and 18. Values include LS mean percent changes with 95% confidence intervals for Rosuvastatin at 20 mg and 40 mg doses and Atorvastatin at 20, 40, and 80 mg doses. The table summarizes efficacy data from a clinical study with sample sizes indicated for each drug group.*
FDA Label Image

Table9.jpg (Table9)

Table9.jpg (Table9)
A data table presenting the effects of various doses of Rosuvastatin (5 mg, 10 mg, 20 mg, and 40 mg) compared to placebo on different lipid parameters, including triglycerides, non-HDL cholesterol, VLDL cholesterol, total cholesterol, LDL cholesterol, and HDL cholesterol, with sample sizes for each group.*

* About these descriptions: Image descriptions on this page are generated by automated AI analysis of the product label images from the manufacturer's FDA label submission (SPL). They are provided for reference only and may contain errors or omissions. Always rely on the printed label itself and the official FDA labeling, and consult a pharmacist or healthcare professional with any questions about this product.