Pregabalin Capsule
Product Images NDC 71610-993

View Photos of Packaging, Regulatory Labels, and Product Appearance

Product Visual Gallery

This gallery contains 16 technical images submitted to the FDA as part of the official labeling for Pregabalin (NDC 71610-993). Unlike standard consumer photos, these assets often include clinical data figures, molecular chemical structures, and official manufacturer packaging layouts.

As provided by Aphena Pharma Solutions - Tennessee, Llc, these visuals offer a comprehensive scientific overview of the product's physical and chemical identity, aiding pharmacists and researchers in product verification and study.

FDA Label Image

Label (71610 0993 30)

Label (71610 0993 30)
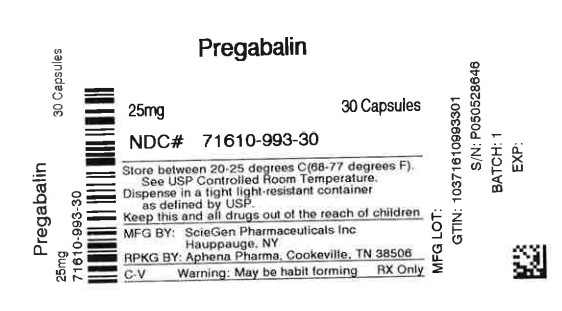
This is a description of a medication called Pregabalin in 25mg strength, packed in a container of 30 capsules with the National Drug Code (NDC) number 71610-993-30. It is recommended to store this product at room temperature (20-25 degrees C or 60-77 degrees F) and in a USP Controlled room. The manufacturer is ScieGen Pharmaceuticals Inc. in Hauppauge, NY, and it is packaged by Aphena Pharma in Cookeville, TN. The medication comes with a warning about potential habit-forming and is only available through prescription. The information includes manufacturing lot number, GTIN number, serial number, batch number, and expiration date.*
FDA Label Image

Aphena (Aphena)

FDA Label Image

Figure 1 (Pregabalin Fig01)

FDA Label Image

Figure 2 (Pregabalin Fig02)

Figure 2 (Pregabalin Fig02)
This document provides data on the percentage of patients showing improvement in pain after taking Pregabalin 160 mg for three days. The chart includes figures such as 100%, 2%, and 10%, alongside numerical values indicating the improvement from baseline.*
FDA Label Image

Figure 3 (Pregabalin Fig03)

FDA Label Image

Figure 4 (Pregabalin Fig04)

Figure 4 (Pregabalin Fig04)
This text provides data on the improvement in pain for a parent of patients who received different treatments. The treatments mentioned include Pregabalin at 200 mg three times a day and at 100 mg three times a day, as well as a placebo. The numerical values listed suggest some sort of assessment or measurement related to pain improvement.*
FDA Label Image

Figure 5 (Pregabalin Fig05)

Figure 5 (Pregabalin Fig05)
This text appears to detail a comparison of the efficacy of different medications in pain management for patients. The medications mentioned are Fregabalin at a dosage of 100 mg three times a day, Pregataiin at 80 mg three times a day, and Placebo. The table shows the number of patients improved and the percentage improvement in pain from baseline. Fregabalin and Pregataiin may be under evaluation for their effectiveness in managing pain based on this data.*
FDA Label Image

Figure 6 (Pregabalin Fig06)

Figure 6 (Pregabalin Fig06)
This text appears to show a comparison between different doses of a medication (50mg/day, 150mg/day, 300mg/day, 600mg/day) and a placebo, detailing the statistical significance of the results. The study may involve evaluating the impact or effectiveness of the medication at different doses compared to no treatment (placebo).*
FDA Label Image

Figure 7 (Pregabalin Fig07)

FDA Label Image

Figure 9 (Pregabalin Fig08)

Figure 9 (Pregabalin Fig08)
This text provides data on the percentage of patients improved with different doses of pregabalin (300mg and 450mg daily) compared to a placebo. The graph shows the percent improvement in pain from baseline over a range of values, ranging from 20 to 280 percent.*
FDA Label Image

Figure 10 (Pregabalin Fig09)

Figure 10 (Pregabalin Fig09)
This is a table showing the estimated percentage of subjects without LTR (Likely To Recommend) for a certain time frame. The table includes data points ranging from 0% to 100% for both the Progabain and Placebo groups over a span of days. Each percentage represents the proportion of subjects in each group who are not likely to recommend. The data seems to indicate a decrease in the percentage over time for both groups.*
FDA Label Image

Figure 11 (Pregabalin Fig10)

FDA Label Image

Figure 12 (Pregabalin Fig11)

Figure 12 (Pregabalin Fig11)
This text provides information on the percentage of subjects improved from baseline to week 16 with pregabalin compared to placebo. The table shows the percent of subjects improved at various points, with a specific focus on the improvement between the baseline and week 16 using the BOCF method.*
FDA Label Image

Figure 13 (Pregabalin Fig13)

Figure 13 (Pregabalin Fig13)
This text appears to be a table showing the Responder Rate (%) for different dosages of a drug, including a placebo. The data includes percentages for different dosage levels, with one of the dosages specified as "Placebo 2.5 mg/kg/day 10 mg/kg/day". It also includes specific responder rates for each dosage level.*
FDA Label Image

Cockcroft And Gault Equation (Pregabalin Formula)

Cockcroft And Gault Equation (Pregabalin Formula)
This text provides a formula to calculate the Cockcroft-Gault Creatinine Clearance (CLCT) for patients. The formula involves subtracting the age in years from 140, then multiplying by the patient's weight in kilograms. For female patients, the result is further multiplied by 0.85. Then the result is multiplied by 72 and divided by the serum creatinine level in mg/dL.*
FDA Label Image

Chemical Structure (Pregabalin Str)

* These product label images have been analyzed using experimental machine learning. Please verify findings with the primary label text.