Pregabalin Capsule
Product Images NDC 71610-994

View Photos of Packaging, Regulatory Labels, and Product Appearance

Product Visual Gallery

This gallery contains 16 technical images submitted to the FDA as part of the official labeling for Pregabalin (NDC 71610-994). Unlike standard consumer photos, these assets often include clinical data figures, molecular chemical structures, and official manufacturer packaging layouts.

As provided by Aphena Pharma Solutions - Tennessee, Llc, these visuals offer a comprehensive scientific overview of the product's physical and chemical identity, aiding pharmacists and researchers in product verification and study.

FDA Label Image

Label (71610 994 30)

Label (71610 994 30)
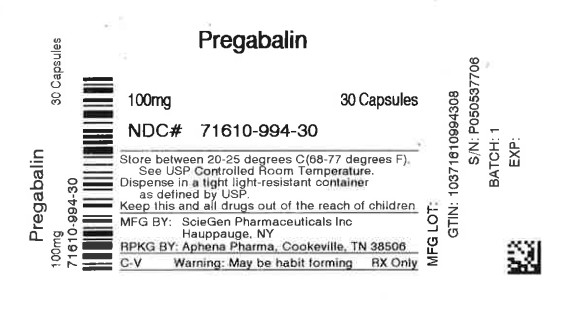
This is a prescription label for Pregabalin, a medication provided in the form of 100mg capsules. The medication should be stored at controlled room temperature and dispensed in a tight-resistant container. It is important to keep this medication and all drugs out of reach of children. The label also includes the NDC number, manufacturing information, and a caution of potential habit-forming nature.*
FDA Label Image

Aphena (Aphena)

FDA Label Image

Figure 1 (Pregabalin Fig01)

Figure 1 (Pregabalin Fig01)
This text provides data on the percent of patients improved in a particular context. The numbers listed indicate the percentage of patients showing improvement. Additionally, there is a mention of percent improvement in pain from baseline.*
FDA Label Image

Figure 2 (Pregabalin Fig02)

Figure 2 (Pregabalin Fig02)
This text appears to be a table showing the percent improvement in pain for patients receiving Pregabalin 160mg over a period of 3 days. The table includes percentages ranging from 2 to 100 and may be used to evaluate the effectiveness of the medication in managing pain.*
FDA Label Image

Figure 3 (Pregabalin Fig03)

FDA Label Image

Figure 4 (Pregabalin Fig04)

Figure 4 (Pregabalin Fig04)
Parent of patients saw an improvement in pain from baseline after taking Pregabalin 200 mg three times a day, Pregabalin 100 mg three times a day or placebo. The data shows positive progress in pain management over time.*
FDA Label Image

Figure 5 (Pregabalin Fig05)

Figure 5 (Pregabalin Fig05)
This text appears to be a list of different medications and their dosages, along with a chart showing the improvement of patients taking those medications. It seems to compare the effectiveness of different drugs in reducing pain levels. The medications mentioned are "Fregabalin 100 mg three times a day," "Pregataiin 80 mg three times a day," and "Placebo". The chart shows the percentage improvement in pain from baseline for different groups of patients.*
FDA Label Image

Figure 6 (Pregabalin Fig06)

Figure 6 (Pregabalin Fig06)
This text appears to be a table showing different studies (E1, E3, S5) evaluating the effects of different dosages of a certain medication (50mg/day, 150mg/day, 300mg/day, 600mg/day) compared to a placebo. The text also mentions that there is a statistically significant difference compared to the placebo.*
FDA Label Image

Figure 7 (Pregabalin Fig07)

FDA Label Image

Figure 9 (Pregabalin Fig08)

FDA Label Image

Figure 10 (Pregabalin Fig09)

FDA Label Image

Figure 11 (Pregabalin Fig10)

FDA Label Image

Figure 12 (Pregabalin Fig11)

Figure 12 (Pregabalin Fig11)
This is a data table showing the percentage of subjects improved over a certain period. The table includes data points at 100, 210, 220, 230, 240, 250, 260, and 270. Additionally, it shows the percentage of improvement from baseline to week 16 for subjects on Pregabalin and Placebo at 280 and 200, respectively. This data can be utilized to analyze the effectiveness of the treatment.*
FDA Label Image

Figure 13 (Pregabalin Fig13)

Figure 13 (Pregabalin Fig13)
This text appears to show different responder rates (%) for a study or experiment. It includes percentages such as 40.6%, 29.1%, and 22.6%. Additionally, there is a mention of a placebo at doses of 2.5 mg/kg/day and 10 mg/kg/day. The final line shows some numerical values. This data likely pertains to a medical or scientific research context, possibly related to the effectiveness of a treatment or medication.*
FDA Label Image

Cockcroft And Gault Equation (Pregabalin Formula)

Cockcroft And Gault Equation (Pregabalin Formula)
This text provides formulae for calculating the Creatinine Clearance (CLCT) for individuals. The first equation involves subtracting the age in years from 140, then multiplying this result by the person's weight in kilograms. For female patients, an additional step includes multiplying the outcome by 0.85. The second equation involves multiplying 72 by the serum creatinine level measured in milligrams per deciliter (mg/dL).*
FDA Label Image

Chemical Structure (Pregabalin Str)

* These product label images have been analyzed using experimental machine learning. Please verify findings with the primary label text.