Pregabalin Capsule
Product Images NDC 71610-995

View Photos of Packaging, Regulatory Labels, and Product Appearance

Product Visual Gallery

This gallery contains 16 technical images submitted to the FDA as part of the official labeling for Pregabalin (NDC 71610-995). Unlike standard consumer photos, these assets often include clinical data figures, molecular chemical structures, and official manufacturer packaging layouts.

As provided by Aphena Pharma Solutions - Tennessee, Llc, these visuals offer a comprehensive scientific overview of the product's physical and chemical identity, aiding pharmacists and researchers in product verification and study.

FDA Label Image

Label (71610 0995 30)

Label (71610 0995 30)
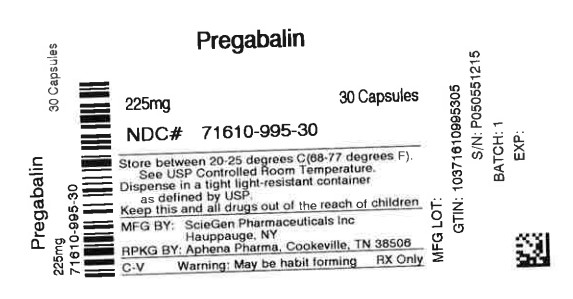
This text is a label for Pregabalin medication showing the dosage information (228mg), quantity (30 capsules), manufacturer details, storage instructions, and a warning about habit-forming potential. The medication is to be stored at room temperature and kept in a light-resistant container. The manufacturing details indicate that it is produced by ScieGen Pharmaceuticals Inc. in Hauppauge, NY, and packaged by Aphena Pharma in Cookeville, TN. Additionally, it provides a manufacturing lot number, GTIN, and serial number for tracking purposes.*
FDA Label Image

Aphena (Aphena)

FDA Label Image

Figure 1 (Pregabalin Fig01)

Figure 1 (Pregabalin Fig01)
Not available.*
FDA Label Image

Figure 2 (Pregabalin Fig02)

Figure 2 (Pregabalin Fig02)
This text provides information on the percentage of patients who improved after taking Pregabalin 160 mg for three days. It also mentions the percent improvement in pain from the baseline.*
FDA Label Image

Figure 3 (Pregabalin Fig03)

Figure 3 (Pregabalin Fig03)
This text provides information about the percentage of patients improved with different medications such as Pregatalin and Pregabalin for pain management. It also mentions the frequency and dosage of the medications administered. Additionally, it shows a chart indicating the percentage of improvement in pain from a baseline.*
FDA Label Image

Figure 4 (Pregabalin Fig04)

Figure 4 (Pregabalin Fig04)
This text appears to be related to monitoring the improvement of patients' pain levels with different treatments, including Pregabalin and a placebo drug. The data mentions taking Pregabalin at various doses throughout the day and notes some improvement in pain compared to the baseline.*
FDA Label Image

Figure 5 (Pregabalin Fig05)

Figure 5 (Pregabalin Fig05)
This appears to be a table showing the effects of different medications (Fregabalin 100mg, Pregabalin 80mg, and Placebo) on patient improvement. The table includes the number of patients improved, as well as the percentage of improvement in pain from baseline. The data seems to indicate various levels of effectiveness for each medication.*
FDA Label Image

Figure 6 (Pregabalin Fig06)

Figure 6 (Pregabalin Fig06)
This text provides information about a study comparing the effects of different dosages of a medication with a placebo. The dosages mentioned are 50mg/day, 150mg/day, 300mg/day, and 600mg/day. The text indicates that there are statistically significant differences compared to the placebo group.*
FDA Label Image

Figure 7 (Pregabalin Fig07)

FDA Label Image

Figure 9 (Pregabalin Fig08)

Figure 9 (Pregabalin Fig08)
This text provides data showing the percentage of patients who experienced improvement in pain levels when taking different doses of Pregabalin daily and placebo. The graph displays the percentages for Pregabalin doses of 300mg and 450mg, as well as a placebo group, over the course of different time intervals. It offers valuable insights into the effectiveness of Pregabalin in managing pain.*
FDA Label Image

Figure 10 (Pregabalin Fig09)

Figure 10 (Pregabalin Fig09)
This appears to be a table showing the estimated percentage of subjects without LTR (Likelihood to Recommend) for a certain product or treatment over various durations. The percentages range from 0% to 100% for both the Progabain and Placebo groups. The data is spread across different durations indicated in days.*
FDA Label Image

Figure 11 (Pregabalin Fig10)

FDA Label Image

Figure 12 (Pregabalin Fig11)

Figure 12 (Pregabalin Fig11)
This text provides information on the percentage of subjects improved over time. It includes data points at 100, 210, 220, 230, 240, 250, 260, and 270. The improvement from baseline to week 16 BOCF is shown for Pregabalin and Placebo at 280 and 200 respectively.*
FDA Label Image

Figure 13 (Pregabalin Fig13)

Figure 13 (Pregabalin Fig13)
This is a table showing responder rates for different treatments, with percentages ranging from 22.6% to 40.6%. There is also a comparison with a placebo treatment at two different dosage levels. The results indicate the effectiveness of the treatments in terms of response rates.*
FDA Label Image

Cockcroft And Gault Equation (Pregabalin Formula)

Cockcroft And Gault Equation (Pregabalin Formula)
This text provides a formula to calculate the Creatinine Clearance (CLCT) based on the age, weight, and serum creatinine levels of a patient. By subtracting 140 from the age in years, multiplying by the weight in kilograms, and then adjusting for gender (0.85 for females), one can determine the Creatinine Clearance. Additionally, by multiplying 72 by the serum creatinine level in mg/dL, one can also calculate the Creatinine Clearance.*
FDA Label Image

Chemical Structure (Pregabalin Str)

* These product label images have been analyzed using experimental machine learning. Please verify findings with the primary label text.