Pregabalin Capsule
Product Images NDC 71610-996

View Photos of Packaging, Regulatory Labels, and Product Appearance

Product Visual Gallery

This gallery contains 16 technical images submitted to the FDA as part of the official labeling for Pregabalin (NDC 71610-996). Unlike standard consumer photos, these assets often include clinical data figures, molecular chemical structures, and official manufacturer packaging layouts.

As provided by Aphena Pharma Solutions - Tennessee, Llc, these visuals offer a comprehensive scientific overview of the product's physical and chemical identity, aiding pharmacists and researchers in product verification and study.

FDA Label Image

Label (71610 996 30)

Label (71610 996 30)
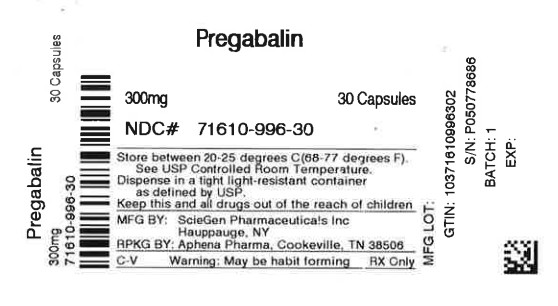
This is a description of Pregabalin medication in the form of 300mg capsules with NDC# 71610-996-30. It should be stored between 20-25 degrees Celsius. The product is packaged by Aphena Pharma and manufactured by ScieGon Pharmaceuticals Inc. It is important to keep this medication out of the reach of children and note that it may be habit-forming. The batch number is 1 with a serial number of P050778686 and the GTIN is 10371610896302. The expiration date and manufacturing lot are not available.*
FDA Label Image

Aphena (Aphena)

FDA Label Image

Figure 1 (Pregabalin Fig01)

FDA Label Image

Figure 2 (Pregabalin Fig02)

Figure 2 (Pregabalin Fig02)
This data appears to show the percentage of patients experiencing improvement in pain after taking Pregabalin 160 mg for three days. The graph or chart may also show different values at different time points.*
FDA Label Image

Figure 3 (Pregabalin Fig03)

FDA Label Image

Figure 4 (Pregabalin Fig04)

Figure 4 (Pregabalin Fig04)
This text appears to describe the improvement observed in the parent of patients due to different treatments involving Pregabalin at varying doses throughout the day alongside a placebo. The text also mentions specific numeric values possibly indicating levels of improvement in pain from baseline.*
FDA Label Image

Figure 5 (Pregabalin Fig05)

Figure 5 (Pregabalin Fig05)
This text appears to provide information on a clinical study comparing the effectiveness of Fregabalin (100 mg three times a day), Pregabalin (80 mg three times a day), and Placebo in improving pain for patients. The table likely shows the percentage of patients improved in each group, as well as the percentage improvement in pain from baseline.*
FDA Label Image

Figure 6 (Pregabalin Fig06)

Figure 6 (Pregabalin Fig06)
This text appears to be a comparison of different study groups administered varying dosages of a substance (possibly medication) and evaluating the statistical significance of the results compared to a placebo group. Dosages ranged from 50mg/day to 600mg/day. The analysis suggests that certain dosages were statistically significant compared to the placebo group.*
FDA Label Image

Figure 7 (Pregabalin Fig07)

FDA Label Image

Figure 9 (Pregabalin Fig08)

Figure 9 (Pregabalin Fig08)
This text provides a chart showing the percentage of patients improved based on different doses of Pregabalin and a placebo in a study evaluating pain improvement from baseline. It shows that the percentage of improvement tends to increase with higher doses of Pregabalin, with the highest improvement seen in patients taking 450mg daily.*
FDA Label Image

Figure 10 (Pregabalin Fig09)

Figure 10 (Pregabalin Fig09)
This is a chart showing the estimated percentage of subjects without LTR (likely to return) over the course of a study. The data is presented in percentages from 100% down to 0%, with values for both a drug (Progabain) and a placebo. The study spans over a period of days, from as little as 10 days up to 180 days. The text also includes numbers labeling the x-axis points on the chart.*
FDA Label Image

Figure 11 (Pregabalin Fig10)

FDA Label Image

Figure 12 (Pregabalin Fig11)

Figure 12 (Pregabalin Fig11)
This text provides data on the percentage of subjects improved after taking Pregabalin and Placebo over a 16-week period. The subjects' improvement percentages are shown at different time points from baseline to week 16. The data includes values ranging from 100 to 280 for Pregabalin and 100 to 200 for Placebo.*
FDA Label Image

Figure 13 (Pregabalin Fig13)

Figure 13 (Pregabalin Fig13)
This text provides information on Responder Rate (%) data at different doses. The rates are 40.6%, 29.1%, and 22.6% for unspecified doses. It also mentions Placebo at 2.5 mg/kg/day and 10 mg/kg/day, with a response rate of 9%.*
FDA Label Image

Cockcroft And Gault Equation (Pregabalin Formula)

Cockcroft And Gault Equation (Pregabalin Formula)
This text provides a formula for calculating Creatinine Clearance (CLcr) in adults. It involves using the patient's age and weight, along with their serum creatinine level. The formula includes adjustments for female patients. By inputting the required values into the formula, healthcare professionals can estimate a patient's renal function, which is crucial for determining appropriate dosages of medications.*
FDA Label Image

Chemical Structure (Pregabalin Str)

* These product label images have been analyzed using experimental machine learning. Please verify findings with the primary label text.