Pregabalin Capsule
Product Images NDC 71610-999

View Photos of Packaging, Regulatory Labels, and Product Appearance

Product Visual Gallery

This gallery contains 16 technical images submitted to the FDA as part of the official labeling for Pregabalin (NDC 71610-999). Unlike standard consumer photos, these assets often include clinical data figures, molecular chemical structures, and official manufacturer packaging layouts.

As provided by Aphena Pharma Solutions - Tennessee, Llc, these visuals offer a comprehensive scientific overview of the product's physical and chemical identity, aiding pharmacists and researchers in product verification and study.

FDA Label Image

Label (71610 0999 30)

Label (71610 0999 30)
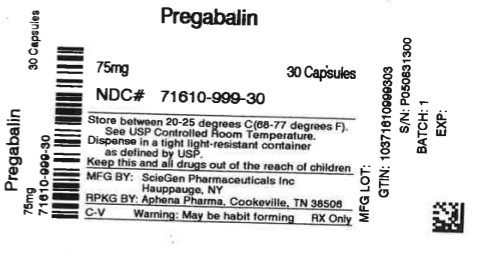
This text provides information about a medication called Pregabalin, which is available in the form of 20 capsules. It includes details such as the NDC number, caution about habit formation, and reference to a manufacturing location. The batch number and serial number are also mentioned, but the expiration date is not available.*
FDA Label Image

Aphena (Aphena)

FDA Label Image

Figure 1 (Pregabalin Fig01)

Figure 1 (Pregabalin Fig01)
This information appears to be a set of data showing the percentage of patients improved, with values being 8, 8, 8, 8, 8, 3, 88, and 8. There is also a mention of "Percent Improvement in Pain from Baseline." It seems like the data may be related to tracking patient improvement or outcomes in a medical or research setting.*
FDA Label Image

Figure 2 (Pregabalin Fig02)

Figure 2 (Pregabalin Fig02)
This data likely refers to the percentage of patients who experienced pain relief after taking Pregabalin 160 mg for three days. The chart shows different percentages of improvement in pain levels compared to the baseline.*
FDA Label Image

Figure 3 (Pregabalin Fig03)

Figure 3 (Pregabalin Fig03)
Not available.*
FDA Label Image

Figure 4 (Pregabalin Fig04)

Figure 4 (Pregabalin Fig04)
This text contains information about the improvement in pain perceived by parents of patients after taking different doses of Pregabalin or placebo. The text mentions specific doses of Pregabalin (200mg and 100mg three times a day) and a placebo, and indicates that there was an improvement in pain from baseline.*
FDA Label Image

Figure 5 (Pregabalin Fig05)

Figure 5 (Pregabalin Fig05)
This information appears to be a comparison of different treatments: pregabalin 100 mg three times a day, pregabalin 80 mg three times a day, and a placebo. The table shows the percentage of patients improved and the percent improvement in pain from baseline for each treatment. The data suggests that pregabalin may have a positive effect on pain management compared to the placebo.*
FDA Label Image

Figure 6 (Pregabalin Fig06)

Figure 6 (Pregabalin Fig06)
This text contains information about a study comparing different doses of a medication (150mg/day, 300mg/day, 600mg/day) with a placebo. It mentions that there was a statistically significant difference found when comparing the medication doses to the placebo.*
FDA Label Image

Figure 7 (Pregabalin Fig07)

FDA Label Image

Figure 9 (Pregabalin Fig08)

Figure 9 (Pregabalin Fig08)
The text shows the percentage of patients who improved using different doses of pregabalin and placebo. It indicates the level of improvement in pain from baseline for each treatment option. The chart shows that the highest percentage of patients improved with the use of 450mg daily dose of pregabalin.*
FDA Label Image

Figure 10 (Pregabalin Fig09)

Figure 10 (Pregabalin Fig09)
This text provides a chart showing the estimated percentage of subjects without long-term retention (LTR) over a period of days. The data includes percentages for both Progabain and Placebo groups, with values ranging from 100% to 0%. The graph seems to show the trend of subjects retaining information over time under different conditions.*
FDA Label Image

Figure 11 (Pregabalin Fig10)

FDA Label Image

Figure 12 (Pregabalin Fig11)

Figure 12 (Pregabalin Fig11)
This text provides information on the percentage of subjects who improved after treatment with Pregabalin and Placebo. It shows the percent improvement from baseline to week 16 using the BOCF (Baseline Observation Carried Forward) method. The data includes values at different intervals such as 100, 210, 220, 230, 240, 250, 260, 270, 280, and 200.*
FDA Label Image

Figure 13 (Pregabalin Fig13)

Figure 13 (Pregabalin Fig13)
This text appears to contain information related to responder rate percentages in a certain study or clinical trial, comparing different dosages including a placebo. The "Responder Rate (%)" is listed as 60% and 50%. Additionally, specific figures are given for different dosages (2.5 mg/kg/day and 10 mg/kg/day) and placebo, where the responder rate percentages are provided as 40.6%, 29.1%, 22.6%, and 9%. Detailed numerical values for responder rates are noted for each group or condition, suggesting comparison of effectiveness or outcomes.*
FDA Label Image

Cockcroft And Gault Equation (Pregabalin Formula)

Cockcroft And Gault Equation (Pregabalin Formula)
This description is not available.*
FDA Label Image

Chemical Structure (Pregabalin Str)

* These product label images have been analyzed using experimental machine learning. Please verify findings with the primary label text.