Rivaroxaban Tablet
Product Images NDC 71921-405

View Photos of Packaging, Regulatory Labels, and Product Appearance

Product Visual Gallery

This gallery contains 9 technical images submitted to the FDA as part of the official labeling for Rivaroxaban (NDC 71921-405). Unlike standard consumer photos, these assets often include clinical data figures, molecular chemical structures, and official manufacturer packaging layouts.

As provided by Florida Pharmaceutical Products, Llc, these visuals offer a comprehensive scientific overview of the product's physical and chemical identity, aiding pharmacists and researchers in product verification and study.

FDA Label Image

Rivaroxaban-container1 (Rivaroxaban Container1)
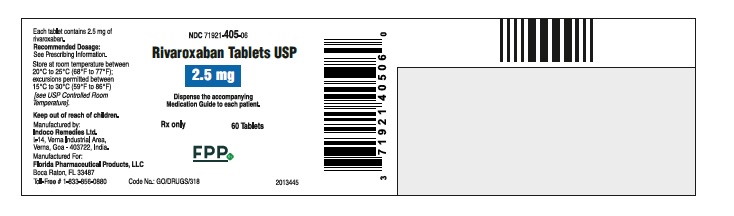
Rivaroxaban-container1 (Rivaroxaban Container1)
Rivaroxaban Tablets USP 2.5 mg oral tablets label from Florida Pharmaceutical Products, LLC. The label shows a 60-tablet count bottle, instructions to dispense the accompanying Medication Guide, storage conditions, and includes barcodes and manufacturer details. It specifies the product is prescription only.*
FDA Label Image

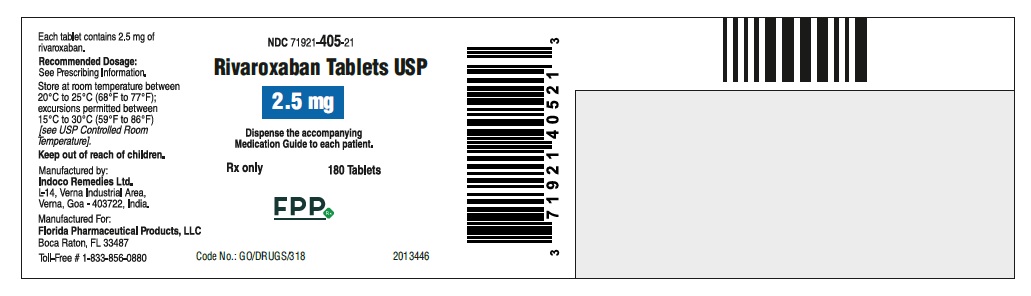
Rivaroxaban-container2 (Rivaroxaban Container2)

Rivaroxaban-container2 (Rivaroxaban Container2)
Label for Rivaroxaban Tablets USP 2.5 mg, oral tablets supplied in a package of 180 tablets. The label includes storage instructions, manufacturer details (Indoco Remedies Ltd., India), and the labeler (Florida Pharmaceutical Products, LLC). It features NDC 71921-405-21, barcode, and advises dispensing the accompanying Medication Guide. The product is Rx only.*
FDA Label Image

Rivaroxaban-fig-10 (Rivaroxaban Fig 10)

Rivaroxaban-fig-10 (Rivaroxaban Fig 10)
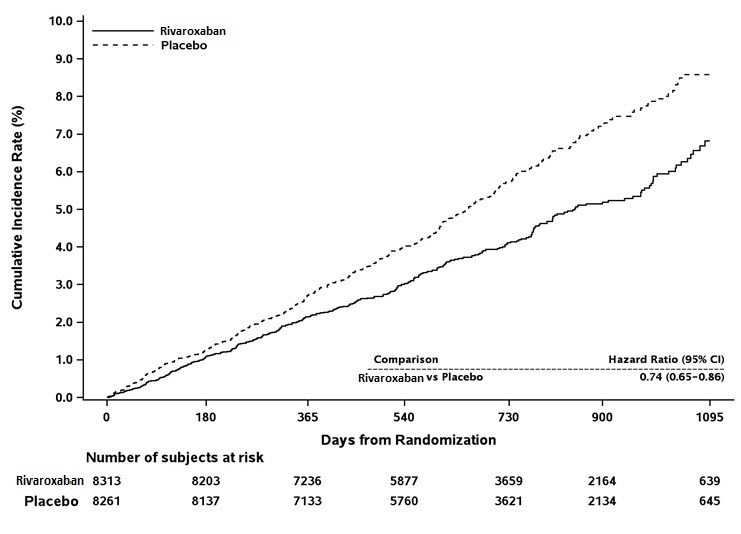
A cumulative incidence rate graph comparing rivaroxaban with placebo over 1095 days from randomization. The y-axis shows percentage incidence, and the x-axis shows days. The graph includes a hazard ratio comparison and the number of subjects at risk for both groups at various time points.*
FDA Label Image

Rivaroxaban-fig-11 (Rivaroxaban Fig 11)

Rivaroxaban-fig-11 (Rivaroxaban Fig 11)
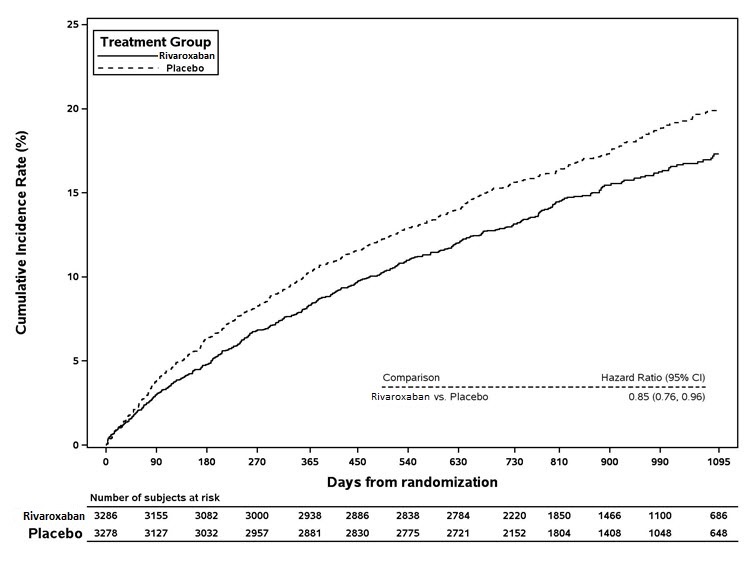
A line graph showing cumulative incidence rates (%) over time (days from randomization) comparing rivaroxaban and placebo treatment groups. The graph includes a table of the number of subjects at risk for each group at various time points and a hazard ratio comparison with 95% confidence interval.*
FDA Label Image

Rivaroxaban-fig-12 (Rivaroxaban Fig 12)

Rivaroxaban-fig-12 (Rivaroxaban Fig 12)
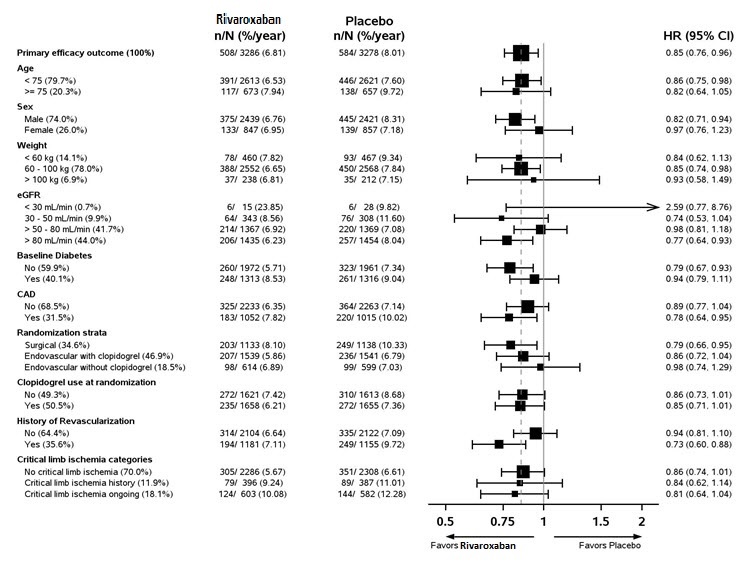
A clinical study forest plot comparing the efficacy outcomes of rivaroxaban versus placebo across various patient subgroups. The plot displays hazard ratios with 95% confidence intervals, including data stratified by age, sex, weight, eGFR, baseline diabetes status, CAD presence, randomization strata, clopidogrel use, history of revascularization, and critical limb ischemia categories. The horizontal axis ranges from 0.5 to 2, indicating favorability towards rivaroxaban or placebo.*
FDA Label Image

Rivaroxaban-fig-2 (Rivaroxaban Fig 2)

Rivaroxaban-fig-2 (Rivaroxaban Fig 2)
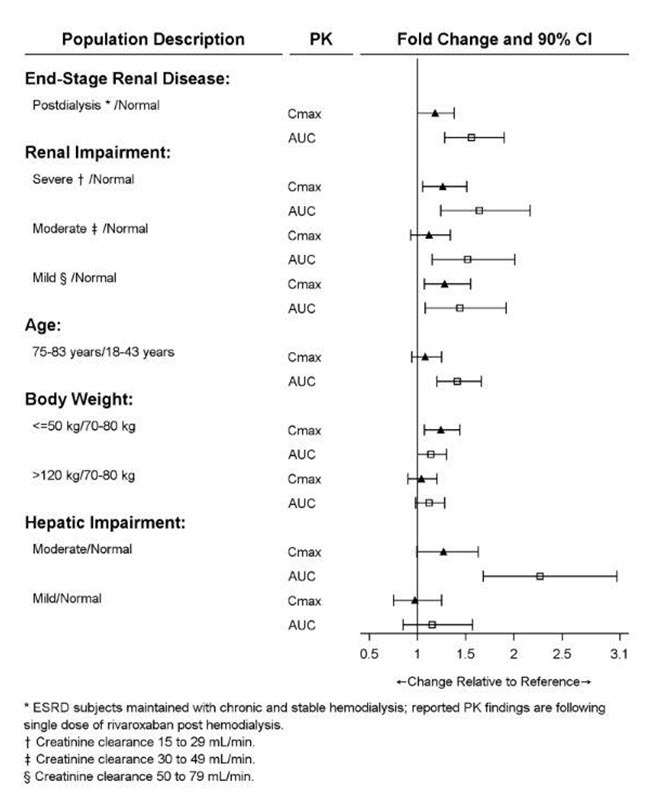
A pharmacokinetic (PK) chart illustrating fold changes and 90% confidence intervals (CI) for maximum concentration (Cmax) and area under the curve (AUC) of rivaroxaban in various populations, including end-stage renal disease, renal impairment, different age groups, body weights, and hepatic impairment. The horizontal axis shows fold change relative to reference from 0.5 to 3.1.*
FDA Label Image

Rivaroxaban-fig-3 (Rivaroxaban Fig 3)

Rivaroxaban-fig-3 (Rivaroxaban Fig 3)
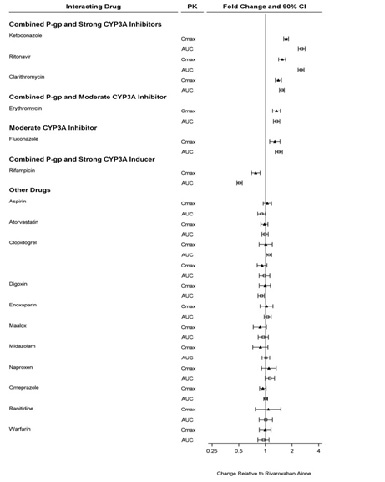
A forest plot chart illustrating the fold change and 90% confidence interval in pharmacokinetic parameters (Cmax and AUC) for rivaroxaban when combined with various drug inhibitors and inducers. The chart categorizes drugs as combined P-gp and strong CYP3A inhibitors, moderate CYP3A inhibitors, strong CYP3A inducers, and other drugs, showing their relative effect on rivaroxaban exposure.*
FDA Label Image

Rivaroxaban-fig-9 (Rivaroxaban Fig 9)

Rivaroxaban-fig-9 (Rivaroxaban Fig 9)
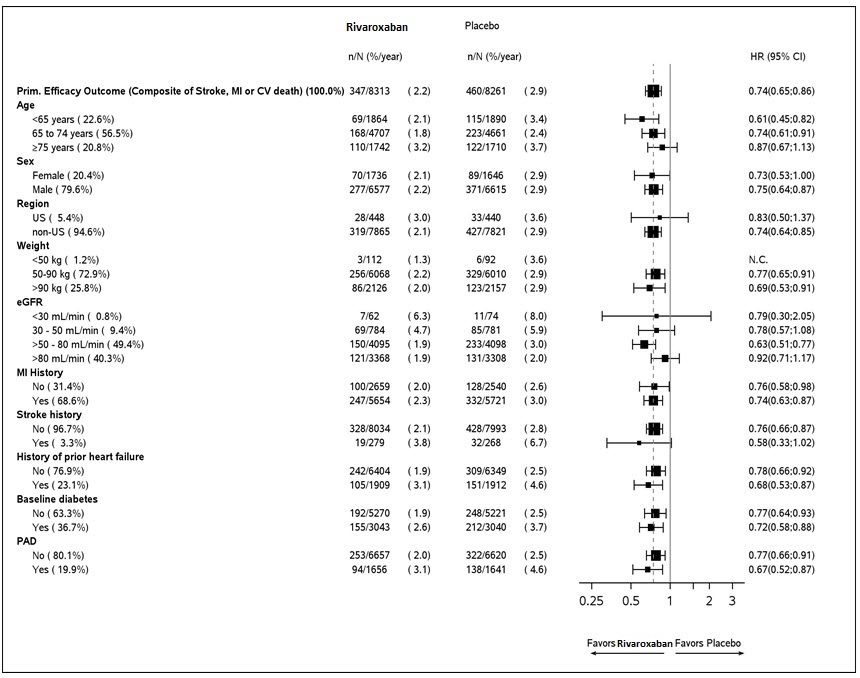
A data table showing comparative efficacy outcomes of rivaroxaban versus placebo across various patient subgroups including age, sex, region, weight, kidney function (eGFR), myocardial infarction history, stroke history, heart failure history, baseline diabetes, and peripheral artery disease (PAD). The table includes event counts, incidence rates, and hazard ratios with 95% confidence intervals, accompanied by a forest plot visualizing the favorability of rivaroxaban versus placebo.*
FDA Label Image

Rivaroxaban-structure (Rivaroxaban Structure)

Rivaroxaban-structure (Rivaroxaban Structure)
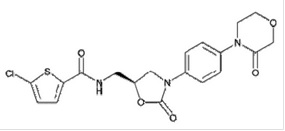
Chemical structure of rivaroxaban, showing the molecular connectivity including a chlorothiophene ring, amide linkage, oxazolidinone ring, and morpholinone moiety.*

* About these descriptions: Image descriptions on this page are generated by automated AI analysis of the product label images from the manufacturer's FDA label submission (SPL). They are provided for reference only and may contain errors or omissions. Always rely on the printed label itself and the official FDA labeling, and consult a pharmacist or healthcare professional with any questions about this product.