Caplyta Capsule
Product Images NDC 72060-110

View Photos of Packaging, Regulatory Labels, and Product Appearance

Product Visual Gallery

This gallery contains 7 technical images submitted to the FDA as part of the official labeling for Caplyta (NDC 72060-110). Unlike standard consumer photos, these assets often include clinical data figures, molecular chemical structures, and official manufacturer packaging layouts.

As provided by Intra-cellular Therapies, Inc, these visuals offer a comprehensive scientific overview of the product's physical and chemical identity, aiding pharmacists and researchers in product verification and study.

FDA Label Image

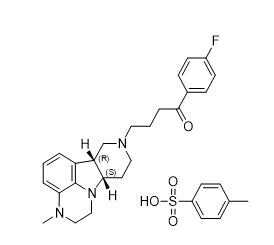
Chemical Structure (Caplyta 1)
Chemical Structure (Caplyta 1)
Chemical structure diagram of lumateperone, the active ingredient in CAPLYTA. The diagram displays molecular bonds and functional groups characteristic of lumateperone's chemical composition.*
FDA Label Image

Figure 1: Effects Of Intrinsic Factors On Lumateperone Pharmacokinetics (Caplyta 2)

Figure 1: Effects Of Intrinsic Factors On Lumateperone Pharmacokinetics (Caplyta 2)
A fold change plot with 90% confidence intervals showing lumateperone pharmacokinetic measures (Cmax and AUCt) related to hepatic and renal impairment. The graph compares mild, moderate, and severe impairment categories on a logarithmic scale of change relative to reference (ratio) from 0.25 to 8.0.*
FDA Label Image

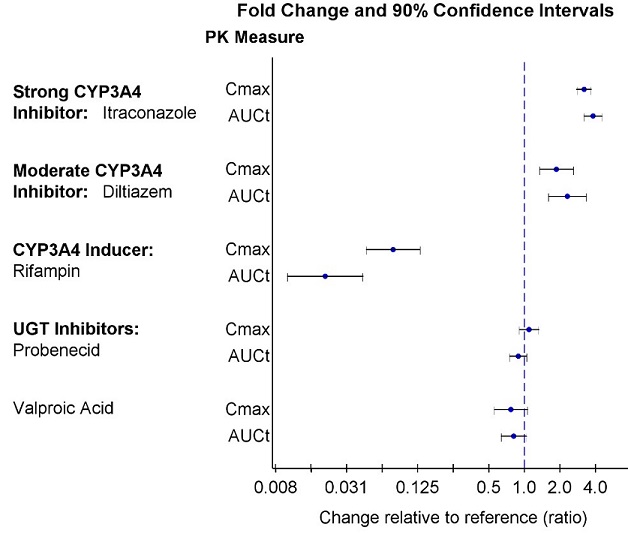
Figure 2: Effects Of Other Drugs On Lumateperone Pharmacokinetics (Caplyta 3)

Figure 2: Effects Of Other Drugs On Lumateperone Pharmacokinetics (Caplyta 3)
A fold change and 90% confidence intervals chart showing pharmacokinetic (PK) measures Cmax and AUCt for CAPLYTA (lumateperone) when coadministered with different inhibitors and inducers. Data compare effects of strong and moderate CYP3A4 inhibitors (itraconazole, diltiazem), CYP3A4 inducer (rifampin), UGT inhibitors (probenecid), and valproic acid on drug exposure ratios relative to reference.*
FDA Label Image

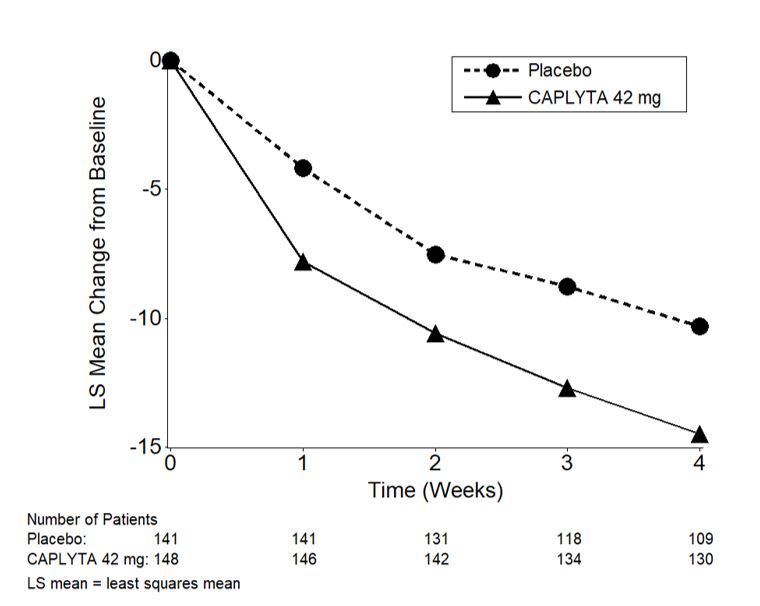
Figure 3. Change From Baseline In Panss Total Score By Time (week) In Patients With Schizophrenia In Study 2. (Caplyta 4)

Figure 3. Change From Baseline In Panss Total Score By Time (week) In Patients With Schizophrenia In Study 2. (Caplyta 4)
A line graph showing the LS mean change from baseline over 4 weeks comparing placebo and CAPLYTA 42 mg. The Y-axis represents the LS mean change from baseline, and the X-axis represents time in weeks. The CAPLYTA 42 mg group shows a greater decrease over time than placebo. Patient numbers for each group at different weeks are listed below the graph.*
FDA Label Image

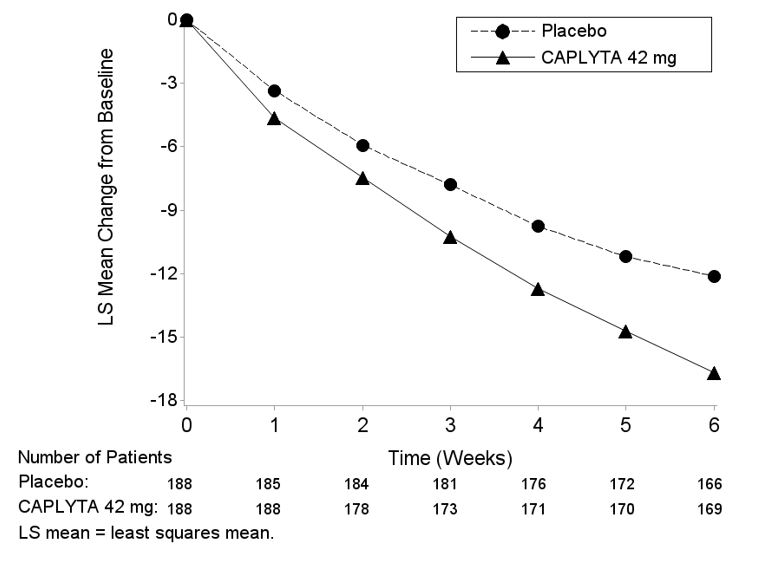
Principal Display Panel (42 mg Capsule Blister Pack Carton)

Principal Display Panel (42 mg Capsule Blister Pack Carton)
A line graph showing least squares mean change from baseline over 6 weeks comparing CAPLYTA 42 mg and placebo. The x-axis represents time in weeks, and the y-axis shows LS mean change from baseline. Two lines depict trends: CAPLYTA 42 mg (solid line with triangles) shows a greater decrease over time than placebo (dashed line with circles). Patient numbers for each group at weekly intervals are listed below the graph.*
FDA Label Image

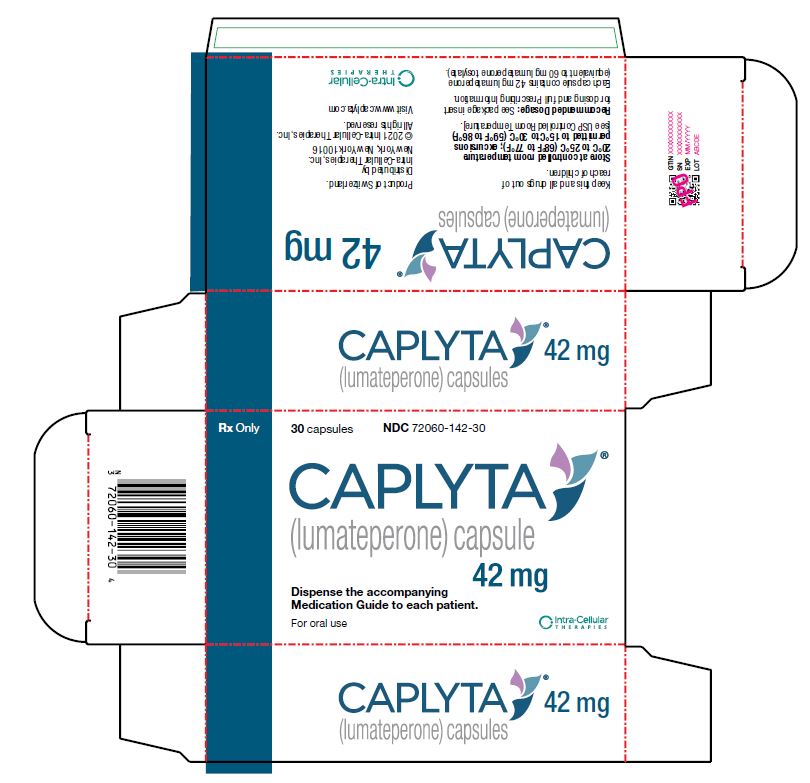
Principal Display Panel (42 mg Capsule Blister Pack Carton)

Principal Display Panel (42 mg Capsule Blister Pack Carton)
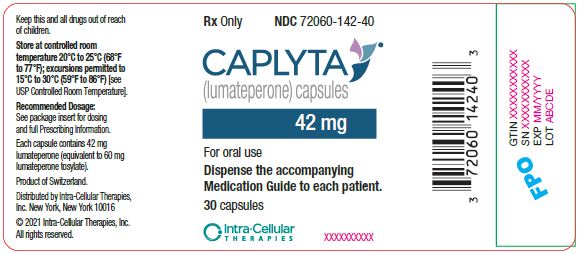
Packaging label for CAPLYTA 42 mg capsules, containing lumateperone as the active ingredient. The carton holds 30 capsules and is labeled for oral use only. It includes instructions to dispense the accompanying Medication Guide to each patient. The labeler is Intra-Cellular Therapies, Inc. The design features the CAPLYTA name prominently with the dosage strength and generic name below.*
FDA Label Image

Caplyta 7

Caplyta 7
CAPLYTA (lumateperone) 42 mg oral capsules carton label showing the product name, dosage strength, and 30 capsule count. The label includes storage instructions, prescription status (Rx Only), manufacturer Intra-Cellular Therapies, Inc, and a barcode. It also notes the product is made in Switzerland and provides dosage guidance to refer to package insert.*

* About these descriptions: Image descriptions on this page are generated by automated AI analysis of the product label images from the manufacturer's FDA label submission (SPL). They are provided for reference only and may contain errors or omissions. Always rely on the printed label itself and the official FDA labeling, and consult a pharmacist or healthcare professional with any questions about this product.