Product Images Pregabalin

View Photos of Packaging, Labels & Appearance

Product Label Images

The following 14 images provide visual information about the product associated with Pregabalin NDC 72162-1543 by Bryant Ranch Prepack, such as packaging, labeling, and the appearance of the drug itself. This resource could be helpful for medical professionals, pharmacists, and patients seeking to verify medication information and ensure they have the correct product.

Label - lbl721621543

Label - lbl721621543

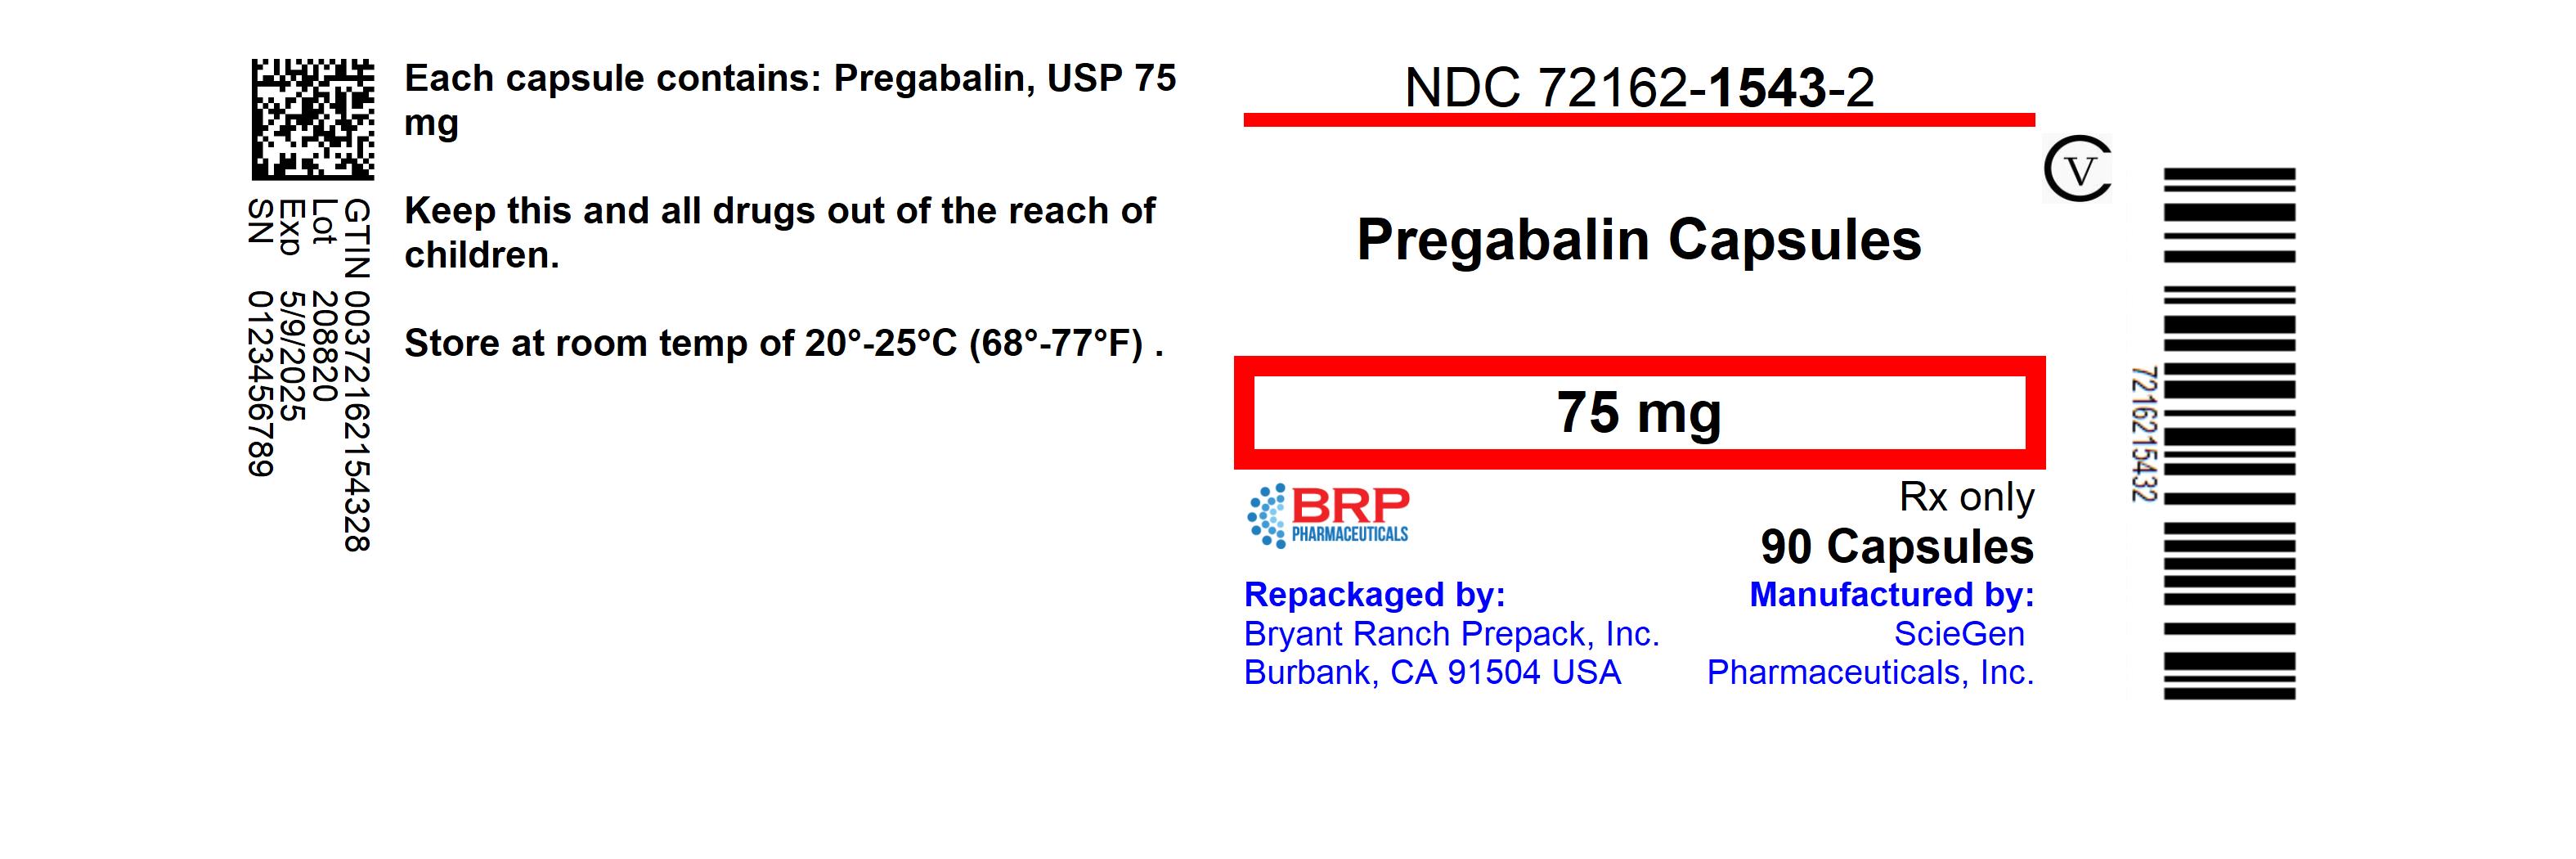
Each capsule of Pregabalin USP 75 contains 75mg of pregabalin. This drug should be kept out of reach of children and stored at room temperature (20°-25°C or 68°-77°F). These capsules are manufactured by ScieGen Pharmaceuticals, Inc. and repackaged by Bryant Ranch Prepack, Inc. This drug is available only by prescription.*

Figure 1 - pregabalin fig01

Figure 1 - pregabalin fig01

The text seems to contain some numeric values related to patient improvement and pain reduction. However, the characters are not organized and some of them couldn't be identified by the . Therefore, it's not possible to generate a useful description.*

Figure 2 - pregabalin fig02

Figure 2 - pregabalin fig02

This appears to be a chart showing the percentage of patients who experienced improvement in pain levels after taking a medication called Pregabalin at a dose of 160 mg for a period of 3 days. The chart shows different pain scores at different time intervals (2w, 220, 23, 20, 280, 2, 20, 2w, 23w) and the corresponding percentage of patients who experienced improvement.*

Figure 3 - pregabalin fig03

Figure 3 - pregabalin fig03

This text appears to be a mix of numerical data and medication names and dosages. It is not clear what the context or purpose of the data is. Thus, the description cannot be provided.*

Figure 4 - pregabalin fig04

Figure 4 - pregabalin fig04

Figure 5 - pregabalin fig05

Figure 5 - pregabalin fig05

The text appears to show the names and doses of medications being administered to patients, as well as some data related to their improvement in pain. However, the text contains many errors and is not readable.*

Figure 6 - pregabalin fig06

Figure 6 - pregabalin fig06

This appears to be a table or graph showing data from multiple studies with different treatment groups and dosages. The names of the studies are E1 and E3, and there is a treatment group labeled S5. The data includes dosage amounts (ranging from placebo to 600mg/day) and a note that the results were statistically significant compared to the placebo group. Therefore, this text appears to be a partial report of clinical trial results for a treatment being studied.*

Figure 7 - pregabalin fig07

Figure 7 - pregabalin fig07

Figure 9 - pregabalin fig08

Figure 9 - pregabalin fig08

The text provides a chart that compares the percent of patients improved with a daily dose of Pregabalin 300mg and Pregabalin 450mg. There is another column for the placebo group. The chart also shows the percent of improvement in pain from baseline. No additional information is available.*

Figure 10 - pregabalin fig09

Figure 10 - pregabalin fig09

This appears to be a chart or table showing estimated percentages of subjects without LTR (potentially related to a medical trial or study) over a certain number of days. The chart includes two groups: one labeled "Progabain" and the other labeled "Placebo". Unfortunately, as can sometimes produce errors when converting text, the exact meaning or context of the chart cannot be confirmed without further information.*

Figure 11 - pregabalin fig10

Figure 11 - pregabalin fig10

Figure 12 - pregabalin fig11

Figure 12 - pregabalin fig11

The text is describing a table or graph showing the percentage of subjects who improved after taking either Pregabalin or a placebo for 16 weeks. The chart displays a range of numbers from 100 to 280 and shows that there was a percentage increase in improvement for those taking Pregabalin. However, without additional context or units of measurement, it's challenging to draw further conclusions from the provided text.*

Cockcroft and Gault equation - pregabalin formula

Cockcroft and Gault equation - pregabalin formula

This appears to be a calculation for estimating creatinine clearance using the Cockcroft-Gault formula, which takes into account a person's age, weight, and serum creatinine level. The mm's represent an unknown value that would need to be replaced with a number, and the "e e" likely represents "x 0.85" for female patients. However, without knowing the actual values for age, weight, and serum creatinine, it's not possible to determine an accurate estimate of creatinine clearance.*

Chemical Structure - pregabalin str

Chemical Structure - pregabalin str

* The product label images have been analyzed using a combination of traditional computing and machine learning techniques. It should be noted that the descriptions provided may not be entirely accurate as they are experimental in nature. Use the information in this page at your own discretion and risk.