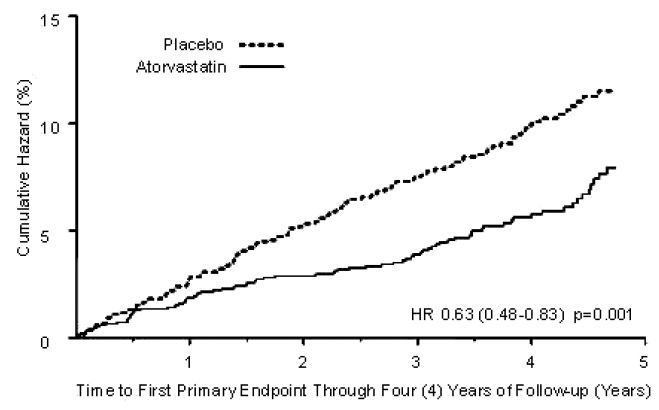
Figure-01 (Figure 01)

This is a statistical report comparing the cumulative incidence of a certain event between two groups receiving different treatments (Atorvastatin and Placebo). The study shows a significant difference in incidence rates, with a hazard ratio of 0.64 (95% CI: 0.50-0.83, p=0.0005) over a period of 3.5 years.*