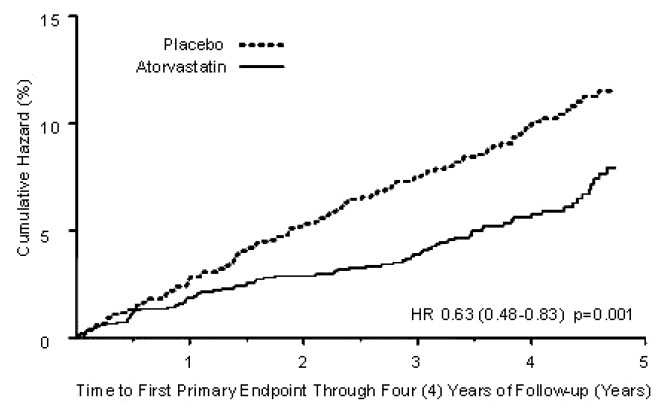
Figure-01 (Figure 01)
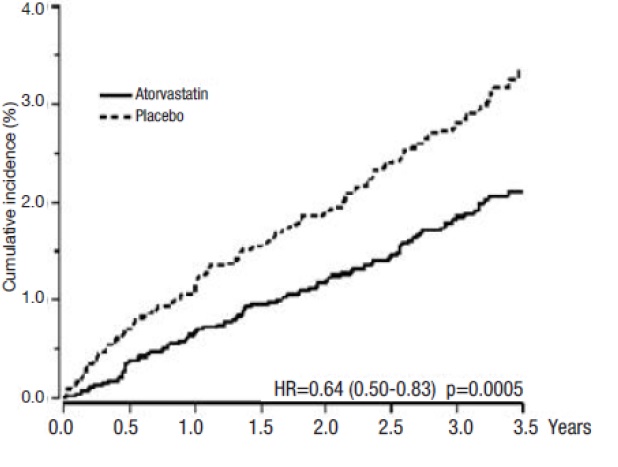
This text appears to be a data table showing the cumulative incidence of an event for two groups, one treated with Atorvastatin and the other with a placebo. The cumulative incidence is given in percentages, with values of 8% and 15% for the two groups. A hazard ratio of 0.64 (95% confidence interval: 0.50-0.83) and a p-value of 0.0005 are provided, indicating a significant difference between the two groups. There are also values of 20, 25, and 3.0 listed, but their meaning is unclear without further context. The data was observed over a period of 3.5 years.*